- Start ES and Kibana on AWS GPU
  - ssh -i "/mnt/c/Users/olive/Google Drive/ML-Buch/aws-gpu-ubuntu.pem" ubuntu@ec2-52-43-168-34.us-west-2.compute.amazonaws.com
  - sudo sysctl -w vm.max_map_count=262144
  - tmux
    - cd elasticsearch-5.5.2/
      - ./bin/elasticsearch
    - cd kibana-5.5.2-linux-x86_64/
      - ./bin/kibana
      - http://ec2-52-43-168-34.us-west-2.compute.amazonaws.com:5601
        - Discover
          - Load Not Cancelled
          - Set interval from (2000-2003(
      - go to dashboard

- Unsupervised in ELK: https://www.elastic.co/downloads/x-pack#preview-release

- Notebooks: ai/notebooks/es
  - Run incremntell import as shown in last step of ```import.ipynb```
Turning Messy Data into Insights
A case study on American Domestic Flight Data
Oliver Zeigermann / @DJCordhose
Domestic US flights from 2000 to 2002
The raw data (per year)
approx. 6 million data sets
> wc -l 2001.csv
5967781 2001.csv
approx. 600 MB of data
> ls -hl 2001.csv
573M Jan 10  2016 2001.csv
29 colums, timestamps
> head 2001.csv
Year,Month,DayofMonth,DayOfWeek,DepTime,CRSDepTime,ArrTime,CRSArrTime,UniqueCarrier,FlightNum,TailNum,ActualElapsedTime,CRSElapsedTime,AirTime,ArrDelay,DepDelay,Origin,Dest,Distance,TaxiIn,TaxiOut,Cancelled,CancellationCode,Diverted,CarrierDelay,WeatherDelay,NASDelay,SecurityDelay,LateAircraftDelay
2001,1,17,3,1806,1810,1931,1934,US,375,N700��,85,84,60,-3,-4,BWI,CLT,361,5,20,0,NA,0,NA,NA,NA,NA,NA
2001,1,18,4,1805,1810,1938,1934,US,375,N713��,93,84,64,4,-5,BWI,CLT,361,9,20,0,NA,0,NA,NA,NA,NA,NA
2001,1,19,5,1821,1810,1957,1934,US,375,N702��,96,84,80,23,11,BWI,CLT,361,6,10,0,NA,0,NA,NA,NA,NA,NA
2001,1,20,6,1807,1810,1944,1934,US,375,N701��,97,84,66,10,-3,BWI,CLT,361,4,27,0,NA,0,NA,NA,NA,NA,NA
Data has gaps, but looks consistent overall
No specific task or question
Exploring what just might be interesting
Finding the unknown unknowns
Your #data from another perspective with #dataviz


https://twitter.com/Creatuluw/status/749151998415634432
https://twitter.com/planetepics/status/914792139309150208
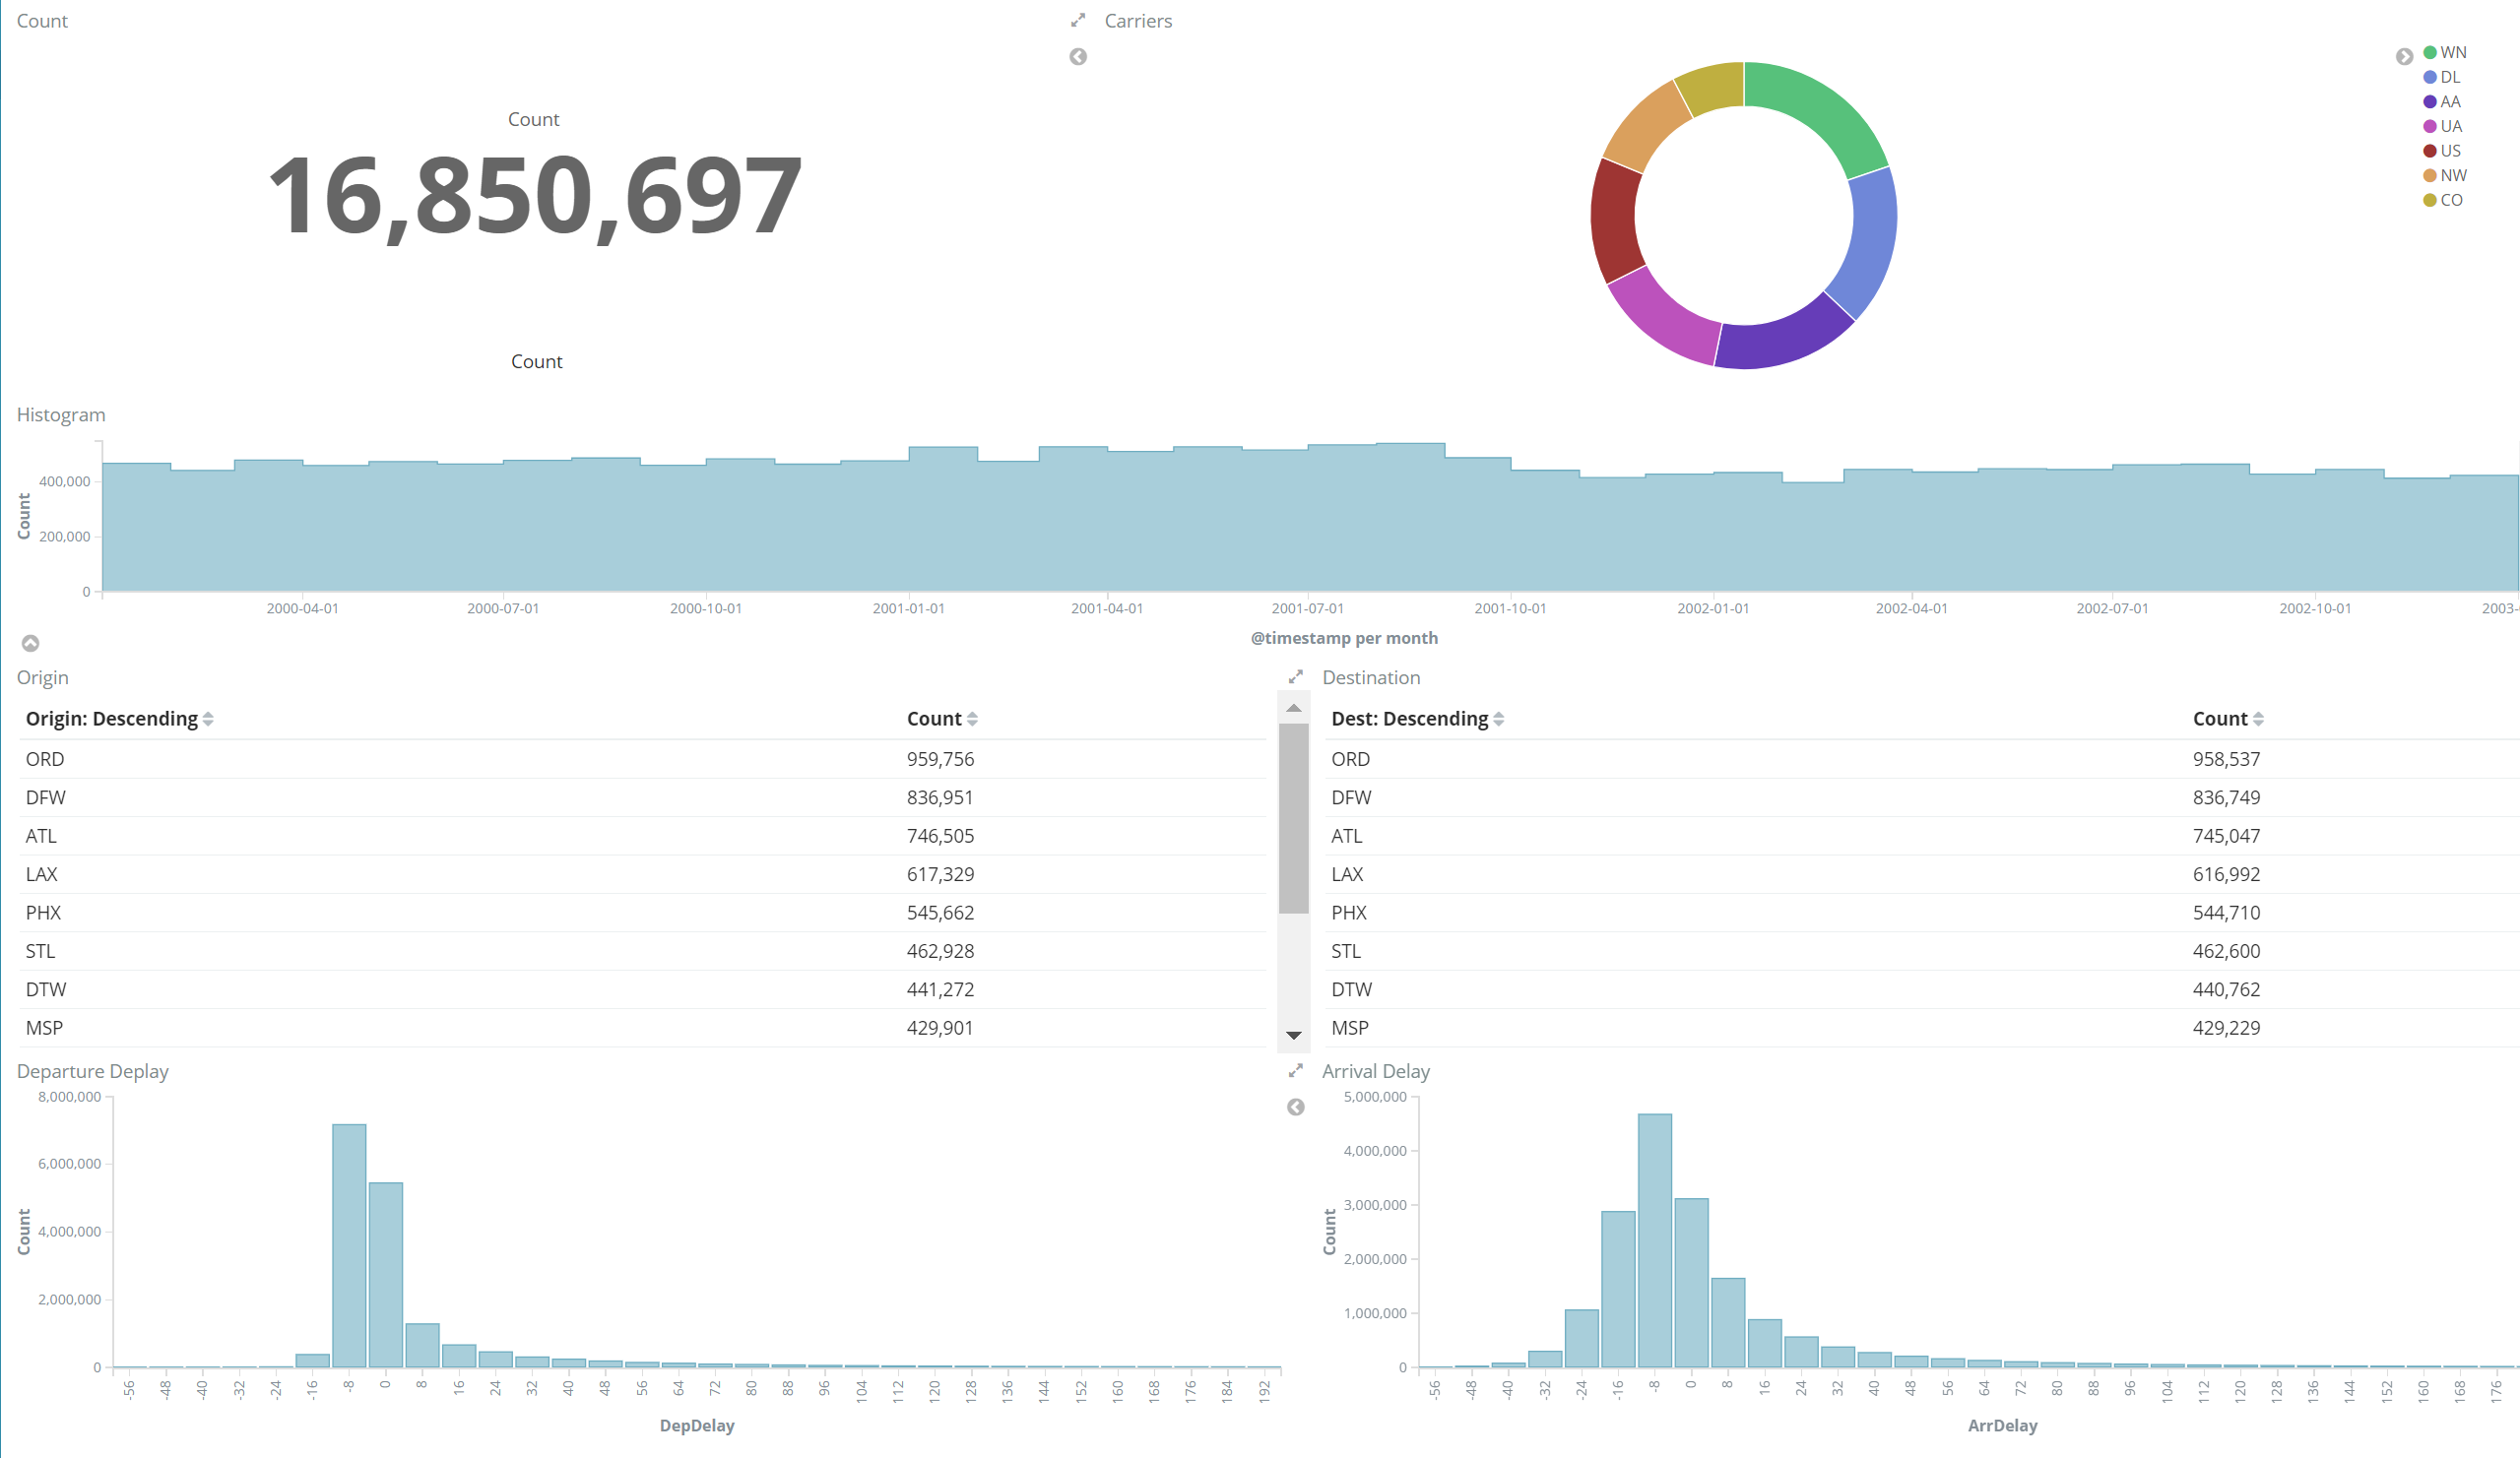
Our first investigation
Explore Data
Visual Statistical analysis using Correlation and Joint Plot
Tools Used
- Basic Processing: UNIX tools
- Cleaning and Import: Dask (Python)
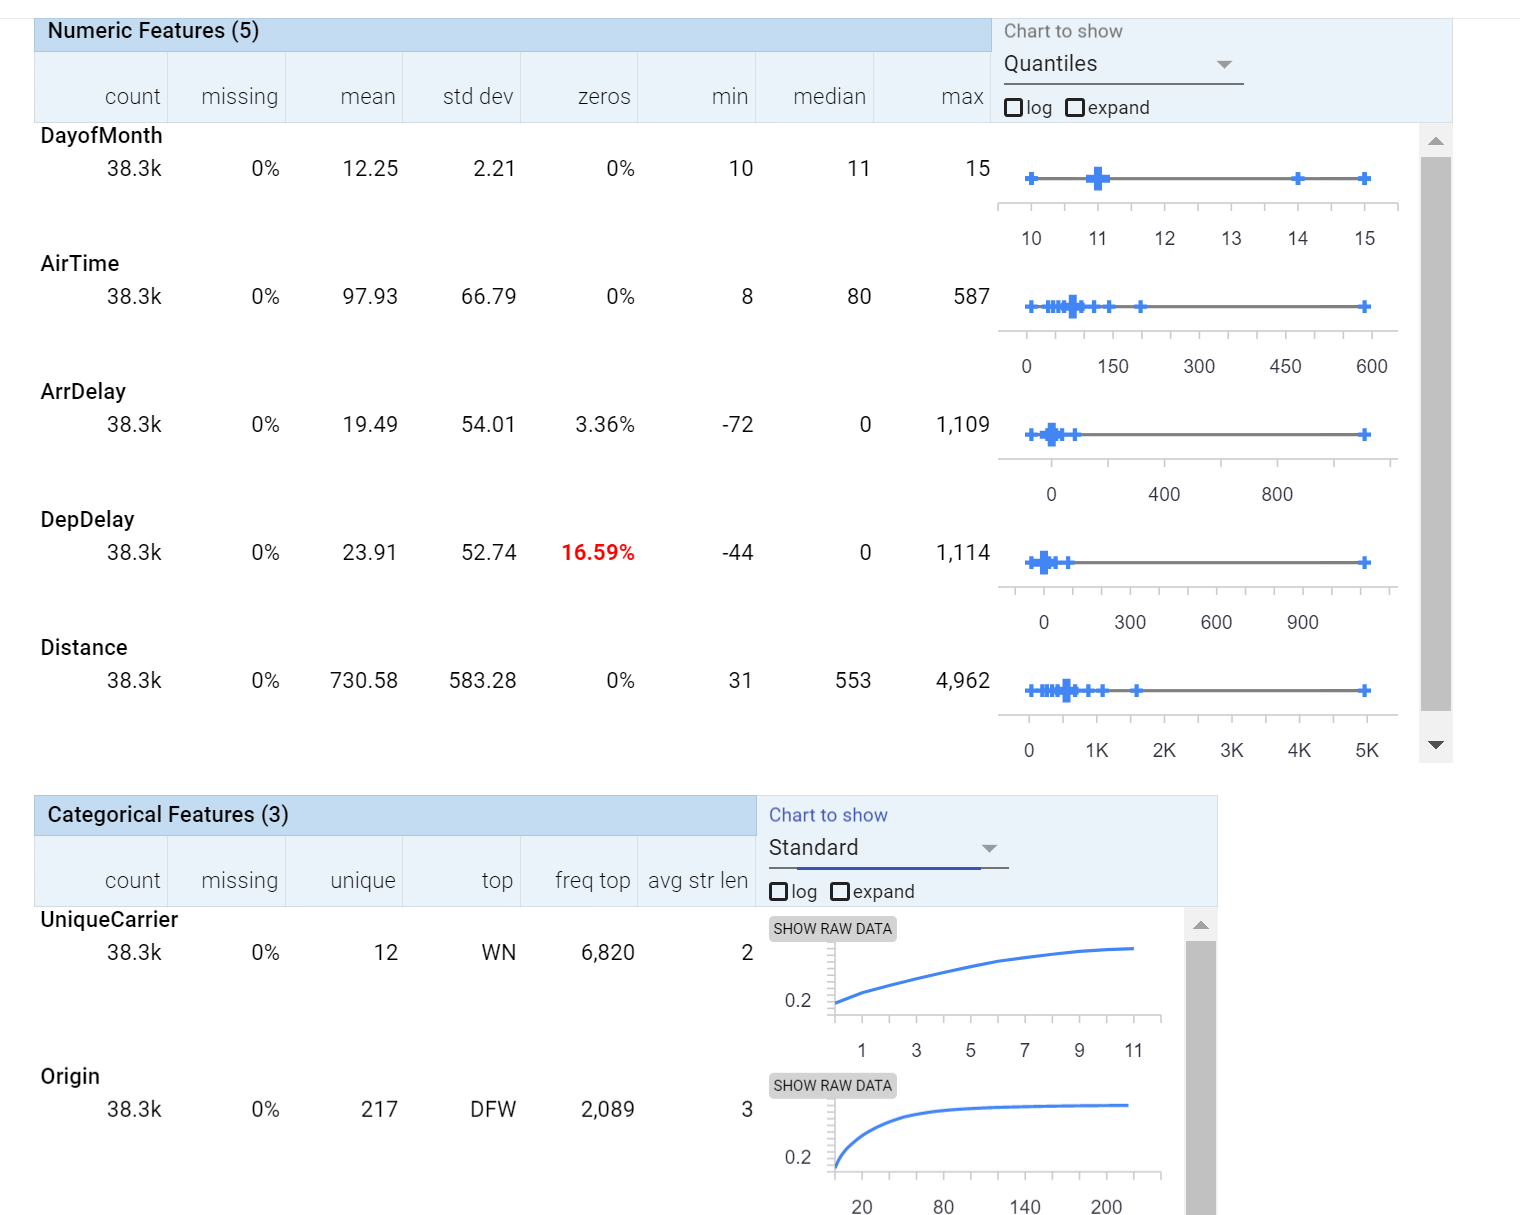
- Statistical analysis: Pandas (Python)
- Display and Interactive Filtering: Elasticsearch and Kibana
Getting an overview using a correlation plot
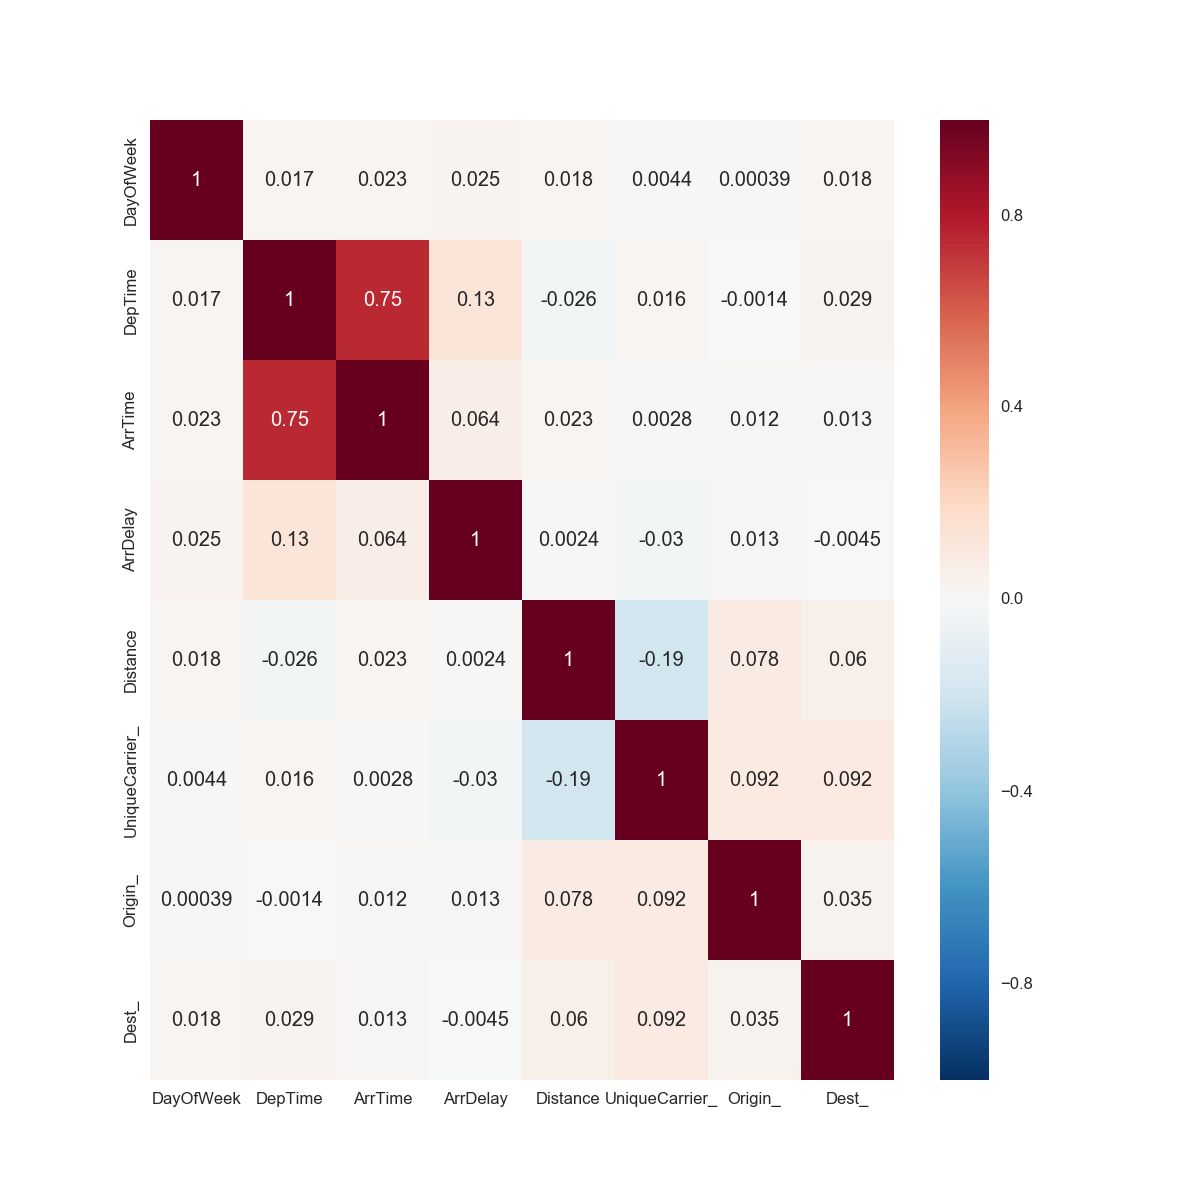
Darker Colours indicate more correlation
Arrival Time to Departure Time
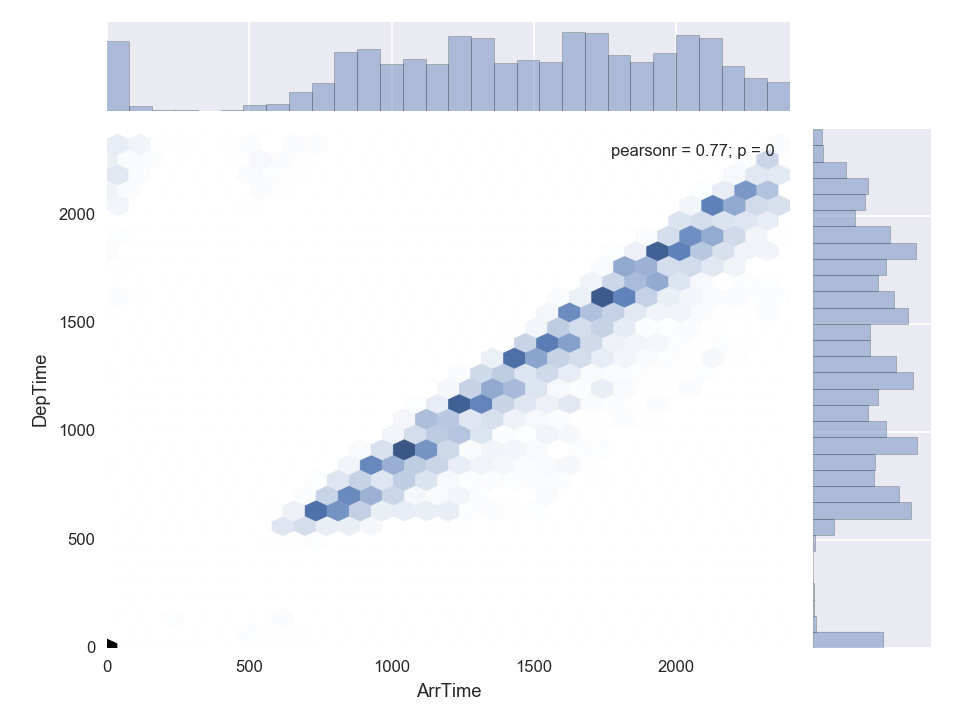
Pearson's r 0.77: high Correlation
Of Course Arrival Time and Departure Time Are Correlated
Verdict: plausible but trivial
Second highest correlation: Distance to Unique Carrier
Distance to Unique Carrier
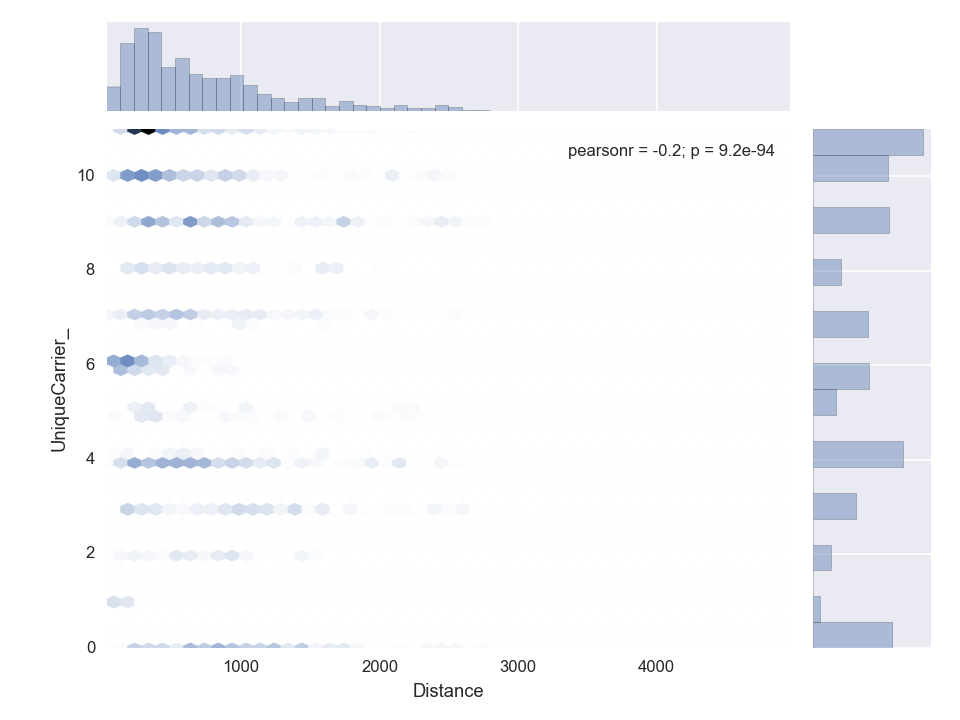
Distance to Unique Carrier
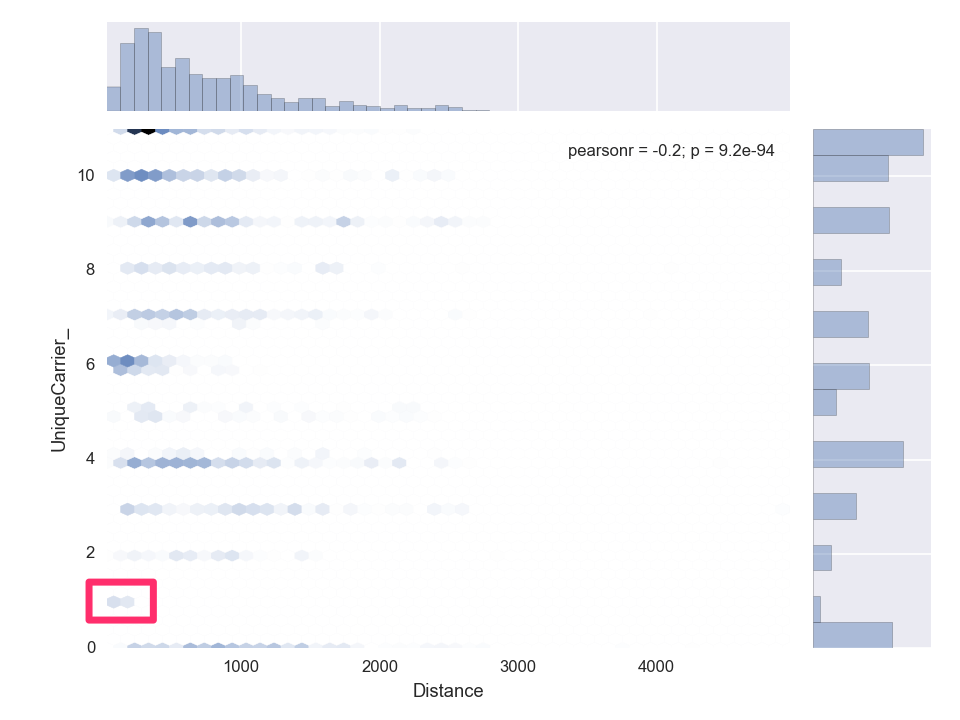
1 = AQ (Aloha Airlines)
Question: Why only short flight distances for Carrier Aloha Airlines (AQ)?
Does anyone know already?

Answer
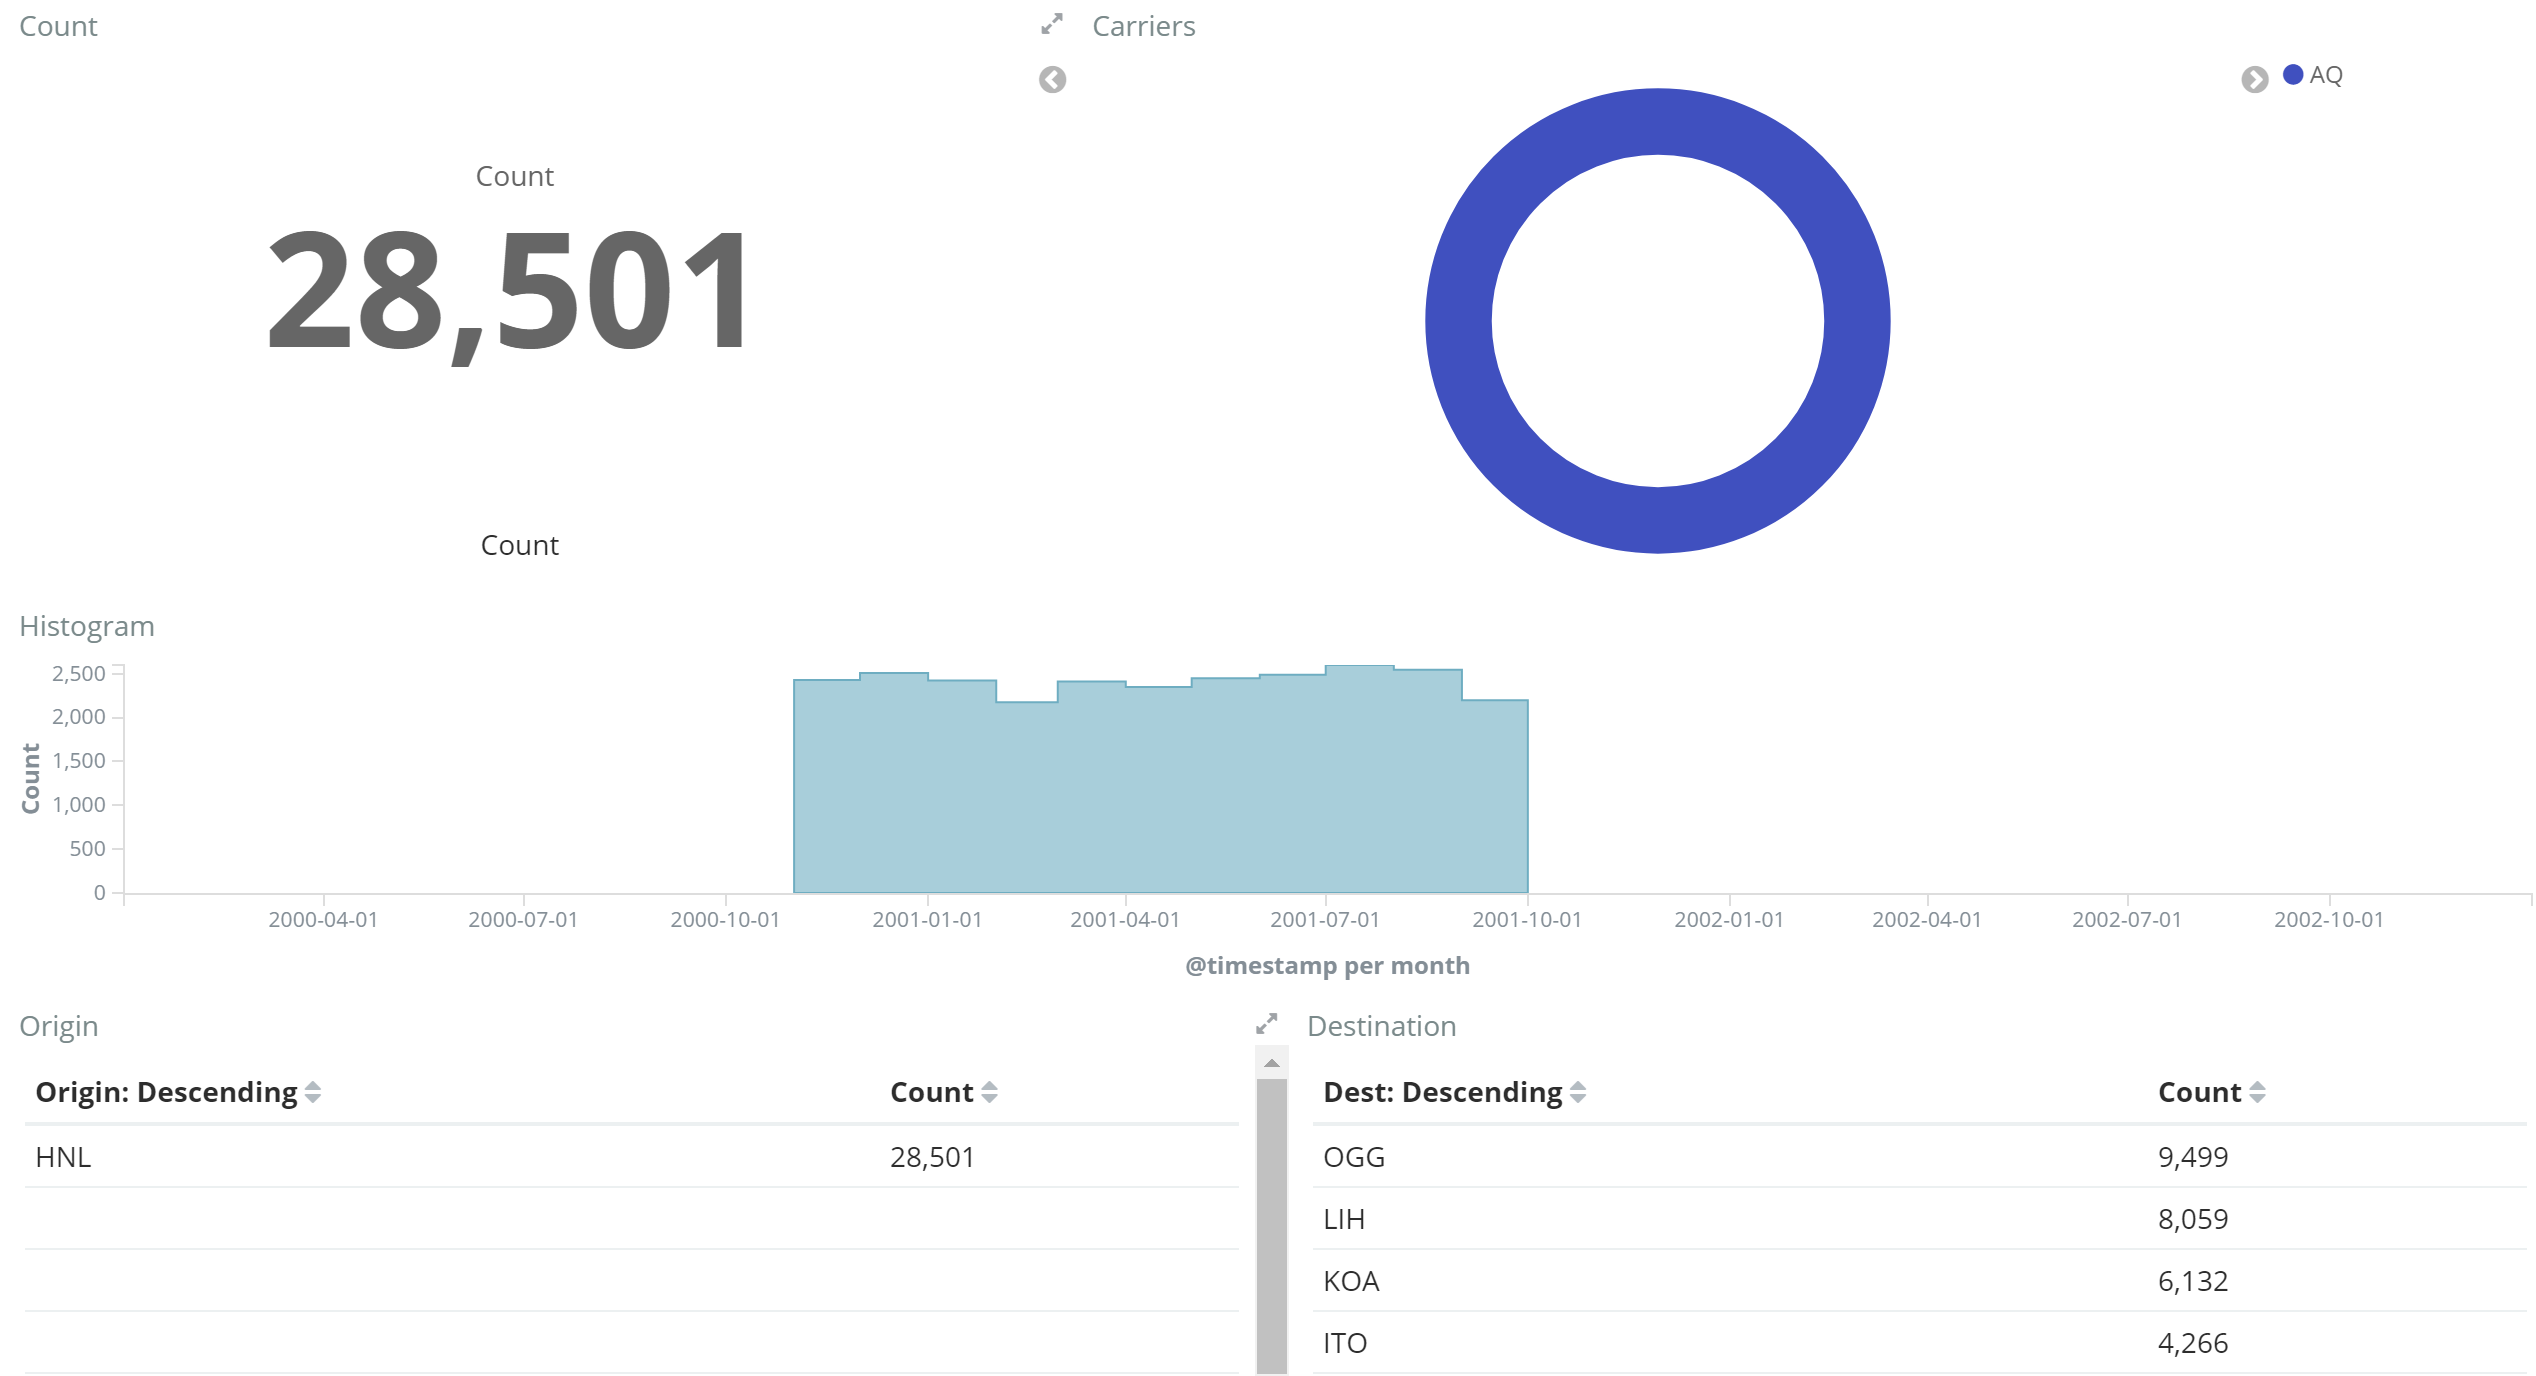
- HNL: Honolulu International Airport
- KOA: Kona International Airport
- OGG: Kahului Airport
- LIH: Lihue Airport
- ITO: Hilo International Airport
Aloha Airlines (AQ) mainly operated on Hawaii
Only data for about 1 year, but AQ existed from from 1946 - 2008
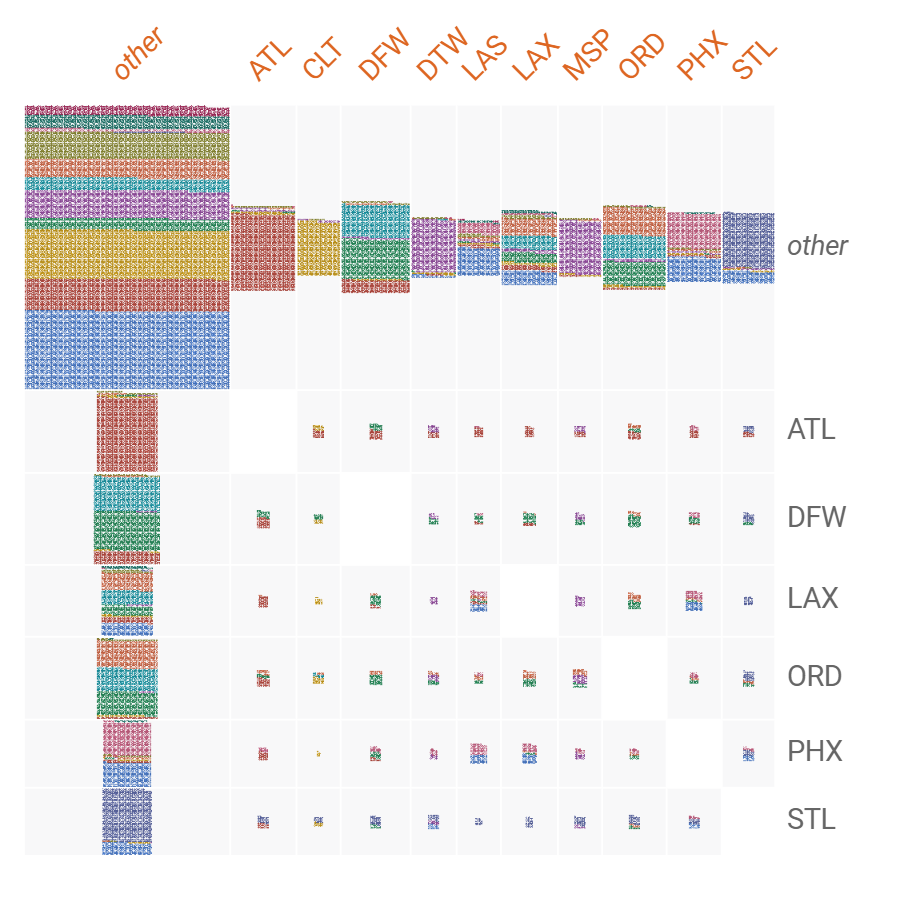
Another (weaker) correlation: Origin to Unique Carrier
Origin to Unique Carrier
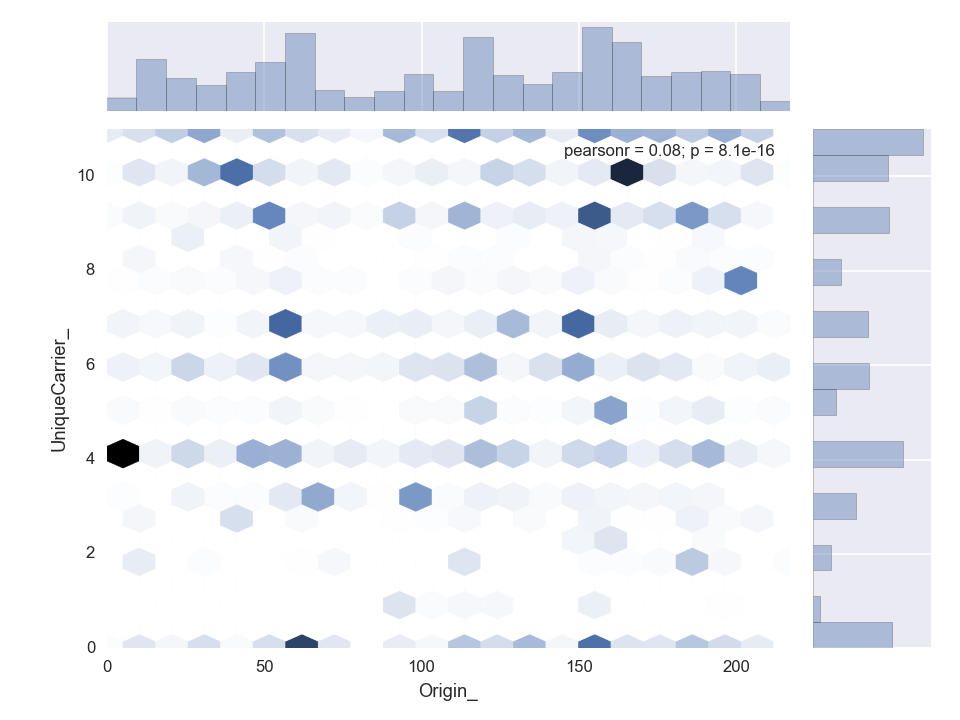
Origin to Unique Carrier
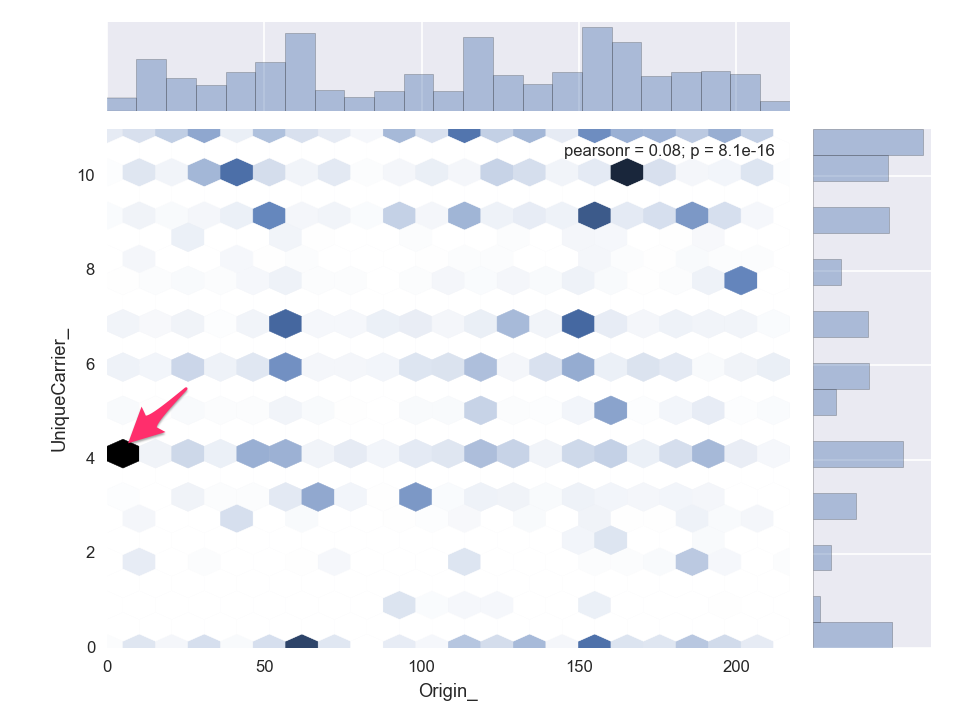
4 = (DL) Delta
Question: What is the prominent Origin for Carrier Delta (DL) and why is there one?
Again: Does anyone know already?
Answer
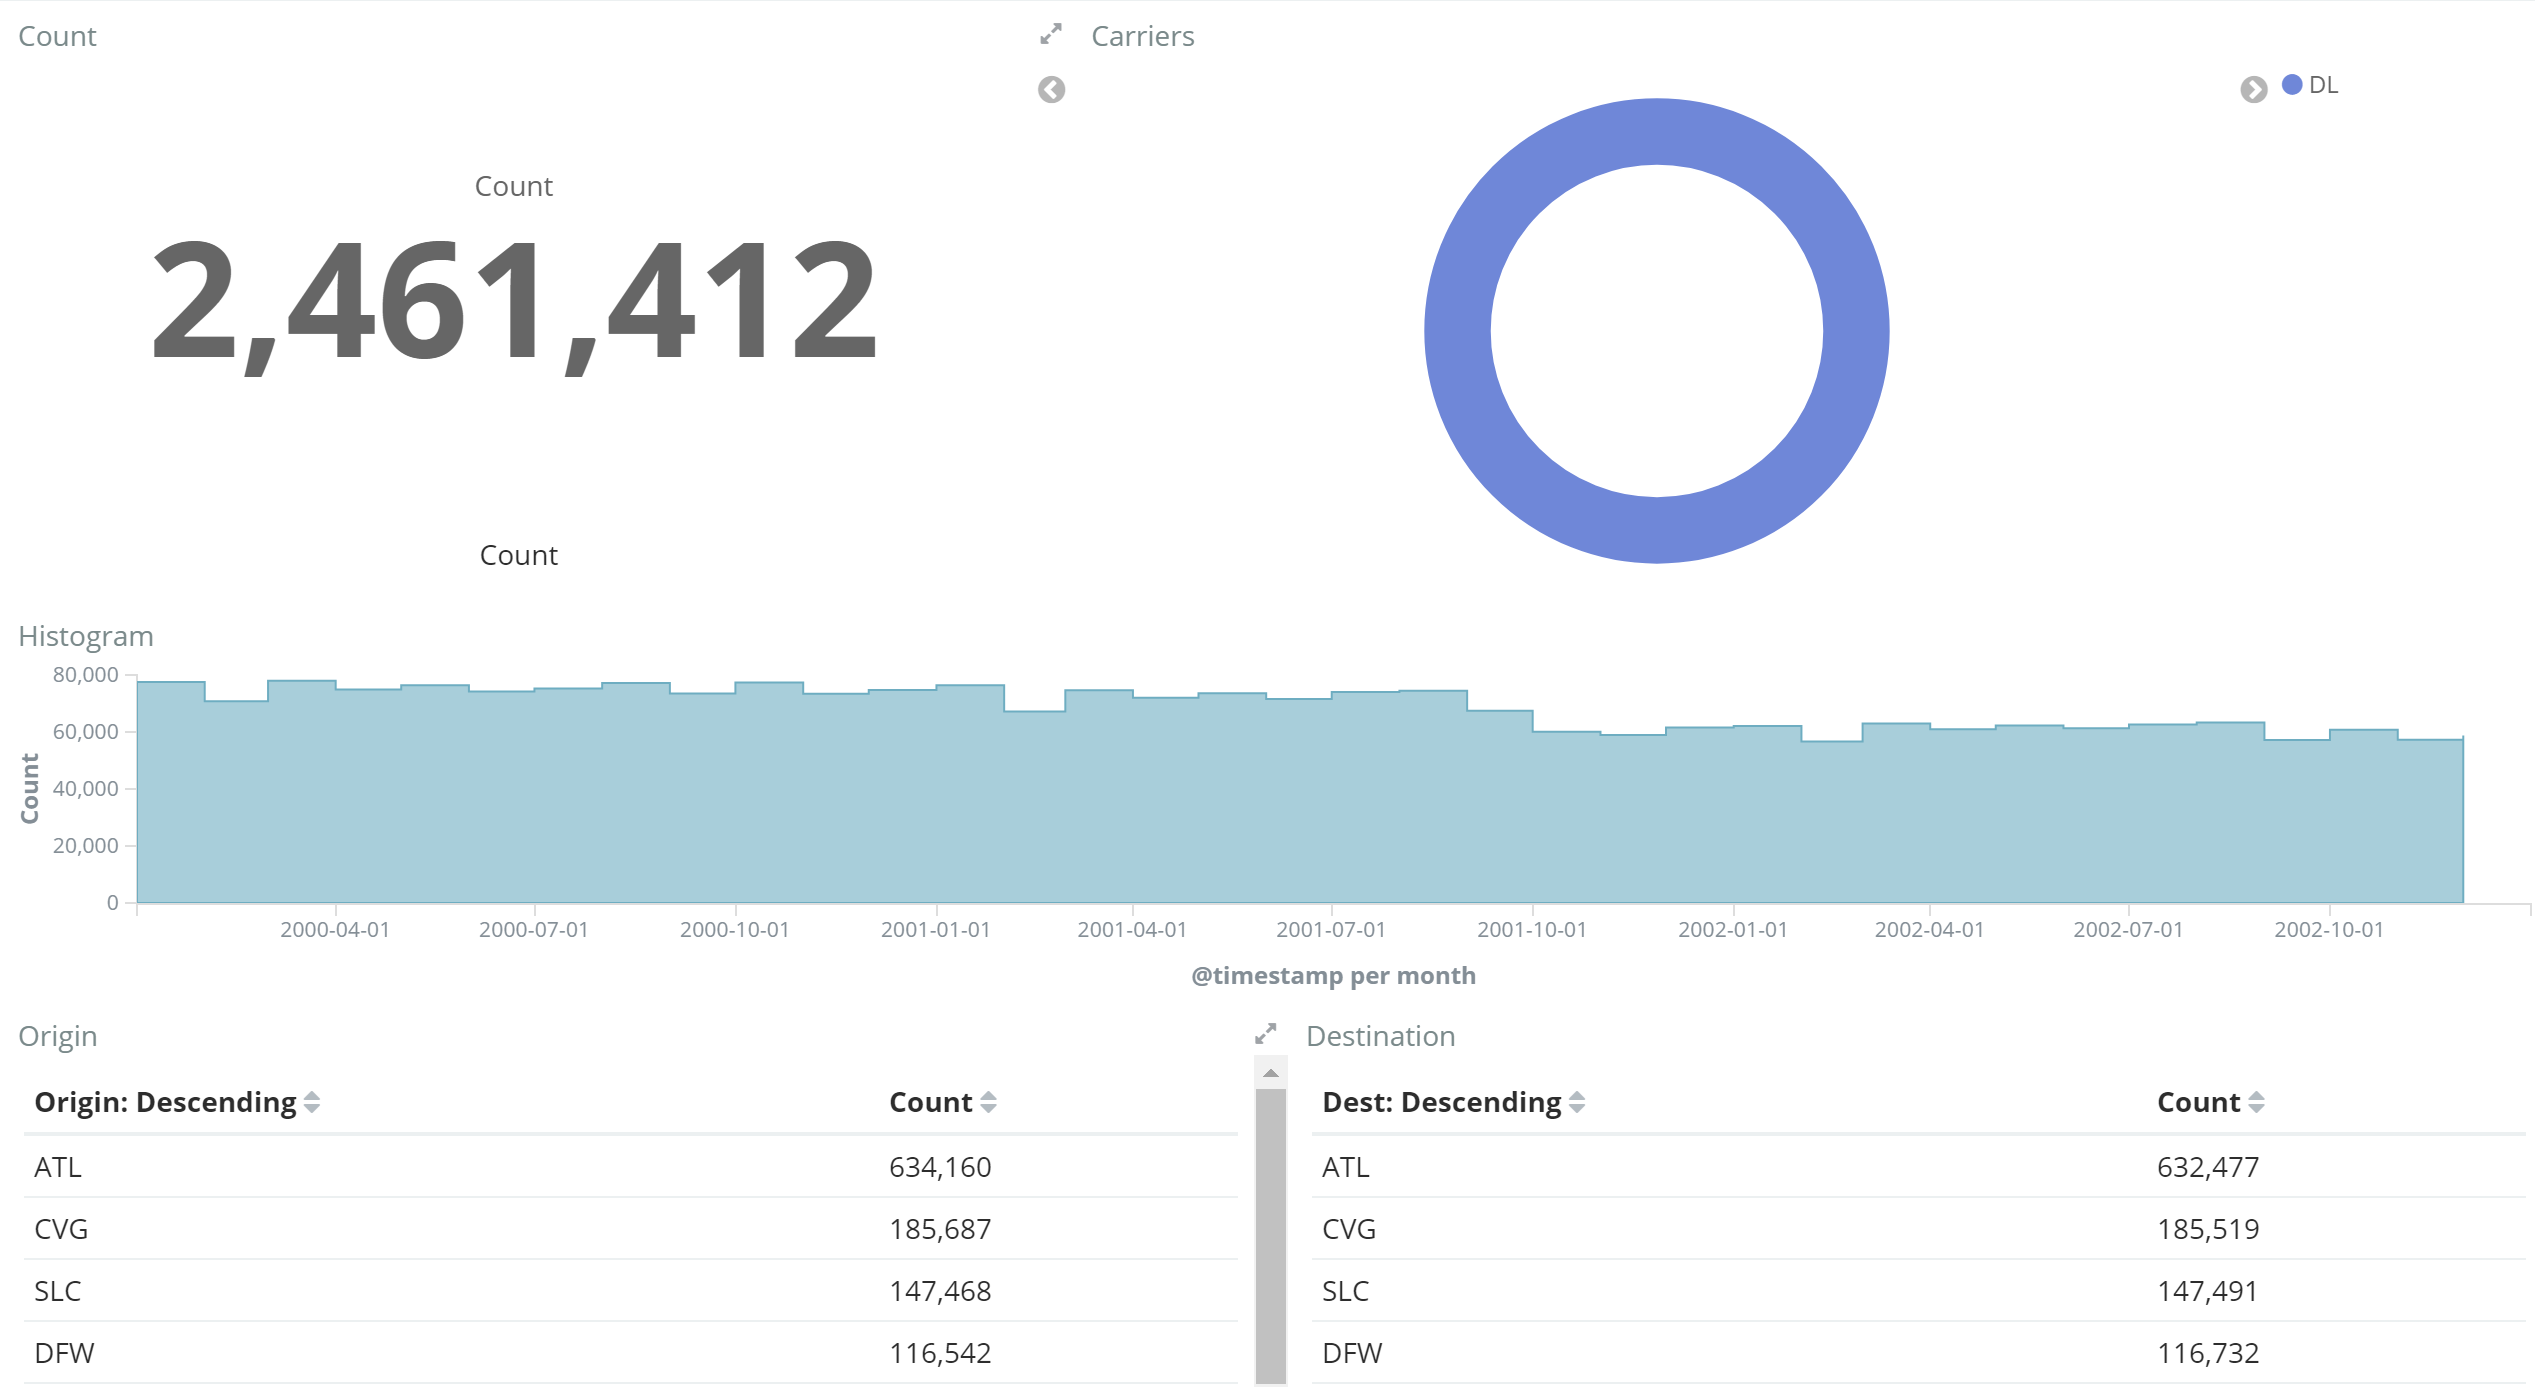
Delta (DL) mainly flies from Atlanta (ATL) its headquarter and largest hub
One More Interesting Observation as an exercise to the audience
When zooming into time series data: What is the recurring dent in the histogram?
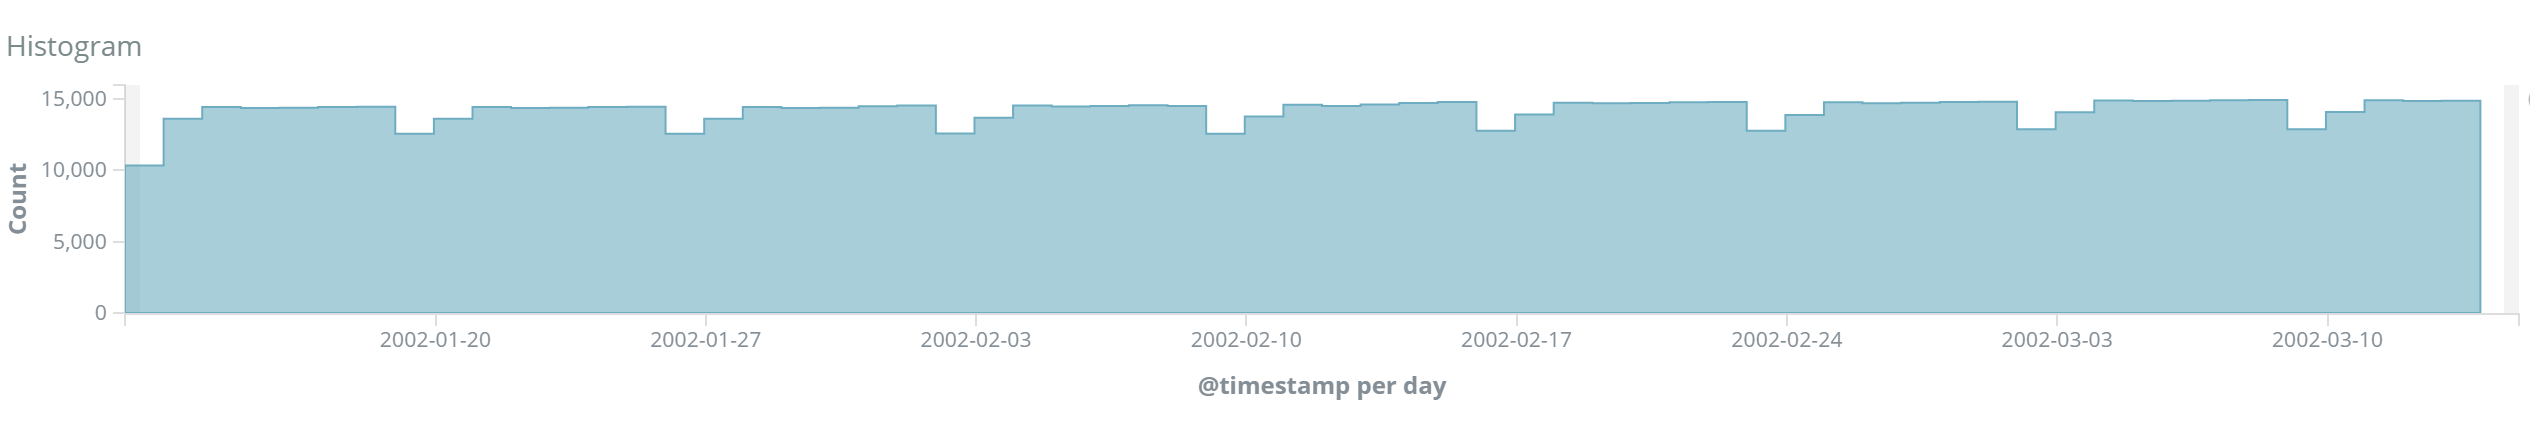
Hint: When filtering for JFK and other mainly international airports, this dent disappears
You can only do this using fancy tools, right?
Why not just load it into Excel and wing it?
- Excel (2011 Mac): truncates
- loads data relatively fast
- truncates after 1M lines
- Google Sheets: nope
- limited to 2.000.000 cells (not lines)
- does not load data at all
- Numbers (Mac): truncates
- loading takes long
- truncates after 64k lines
- Emacs: Low-level operations possible
- very fast and almost no memory overhead
- just a text editor
Data Size too big
But we can at least work on samples
Exploring Data using Google Sheets

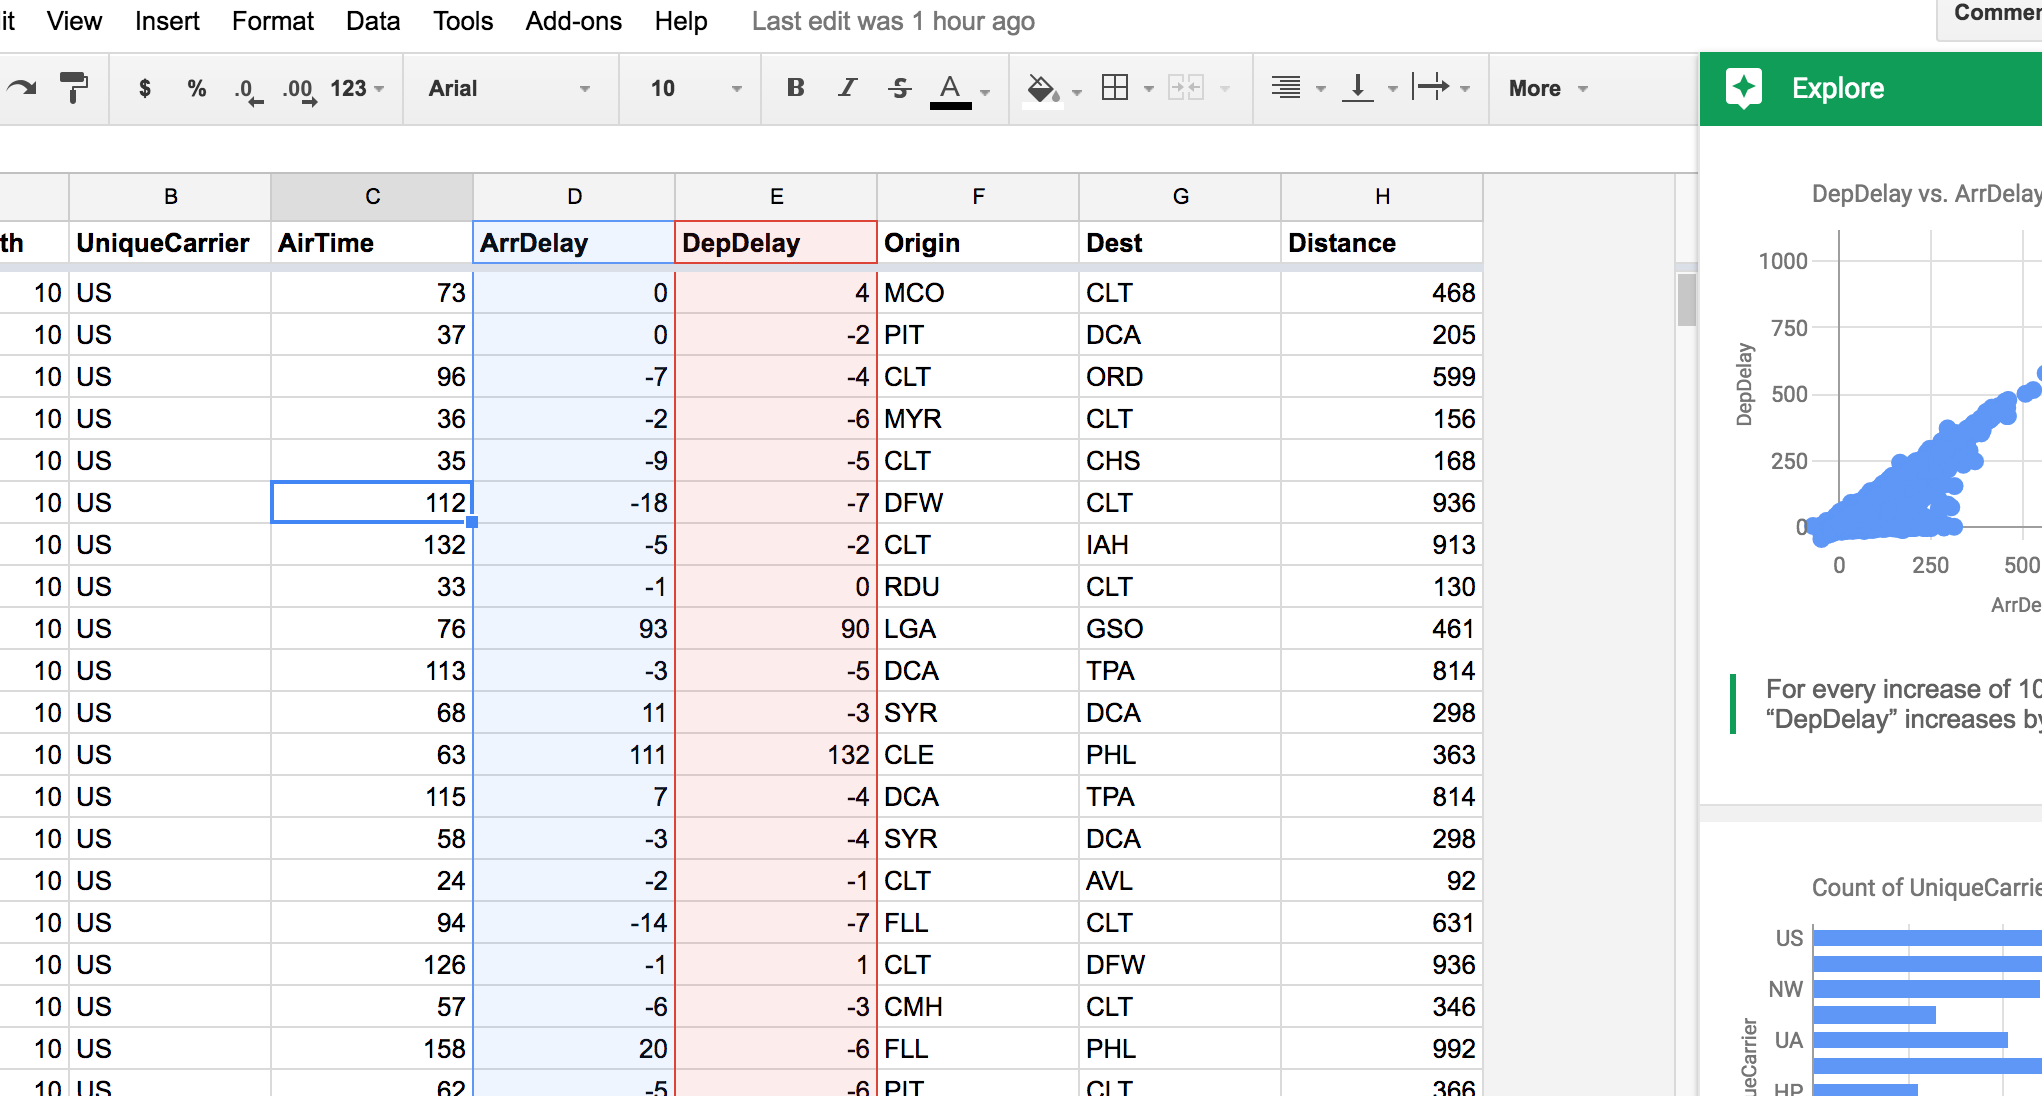
Uses Unsupervised Machine Learning

Correlations, Outliers, etc.
Sheets can automatically find this
Facets Dive
Lets you pivot on random data
Destination to Origin, Carrier encoded as color
https://pair-code.github.io/facets/index.html#facets-dive
What I have learned
Without asking
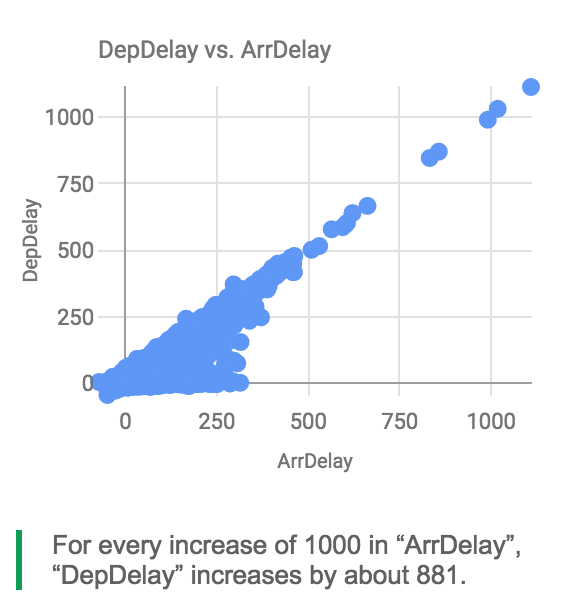
- long arrival delays are caused by departure delays
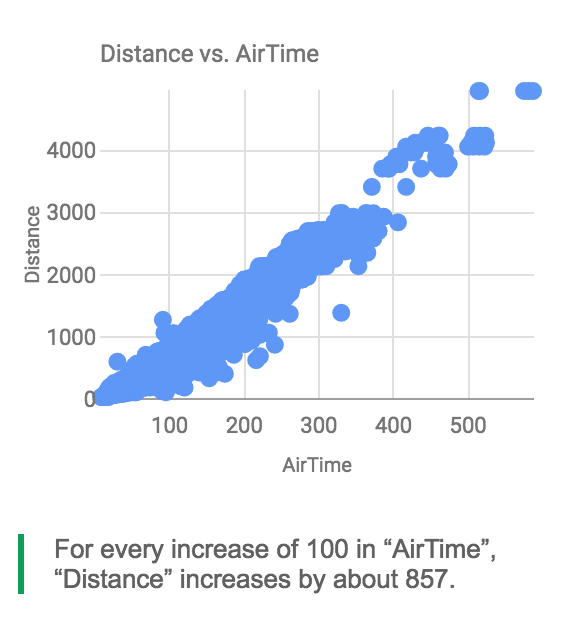
- per 100 minutes you can fly around 857 miles
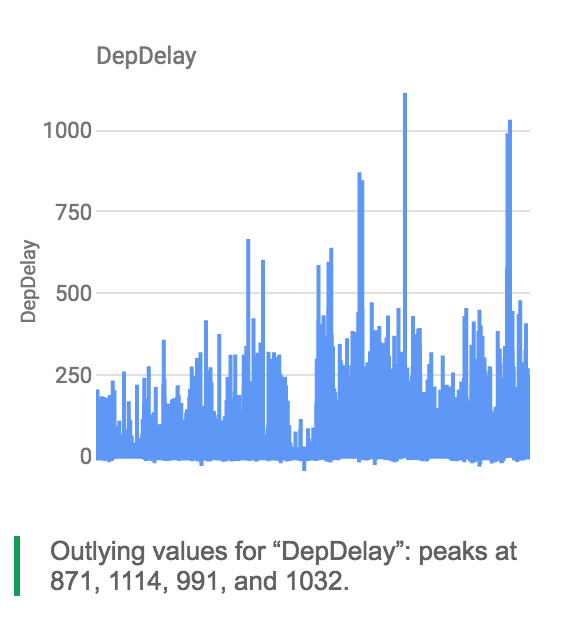
- some flights where delayed more than 1000 minutes (more than 16 hours)
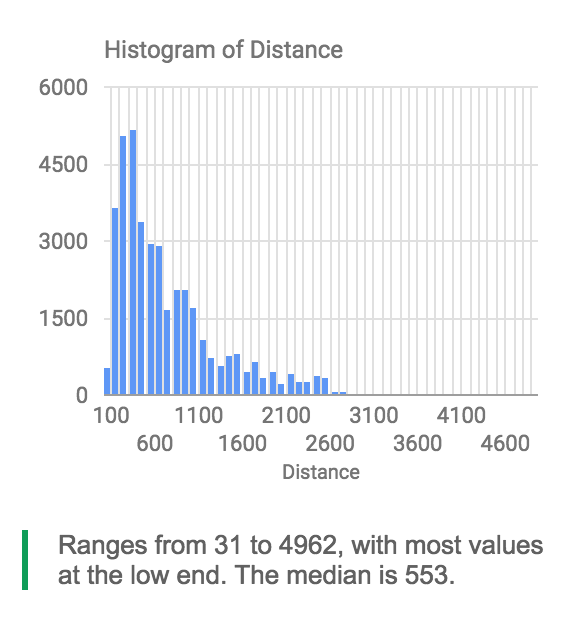
- there seems to be a flight distance of 4962 miles in the US (around 10 hours of flight)
- ATL is DL's home base
- there is an interesting gap at weekends
- there is plenty more insights hidden inside that data
Wrapup
- Statistic Analysis gives first insights
- Interactive Exporation lets us find most interesting relationships
- Unsupervised ML reveals hidden structures
- interpretation requires domain knowledge
- experiments also help with interpretation of data
- interpretation and understanding is the prerequisite to action
http://bit.ly/data-insights-ml-101
Ping me for questions / help / comments: http://zeigermann.eu / @DJCordhose