Interactive Big Data Exploration Tools for the Browser
A Survey
data2day 2016
Target audience
- Domain Expert: What is possible in visual exploration?
- Technical Expert: What tools can I use to support the Domain Expert?
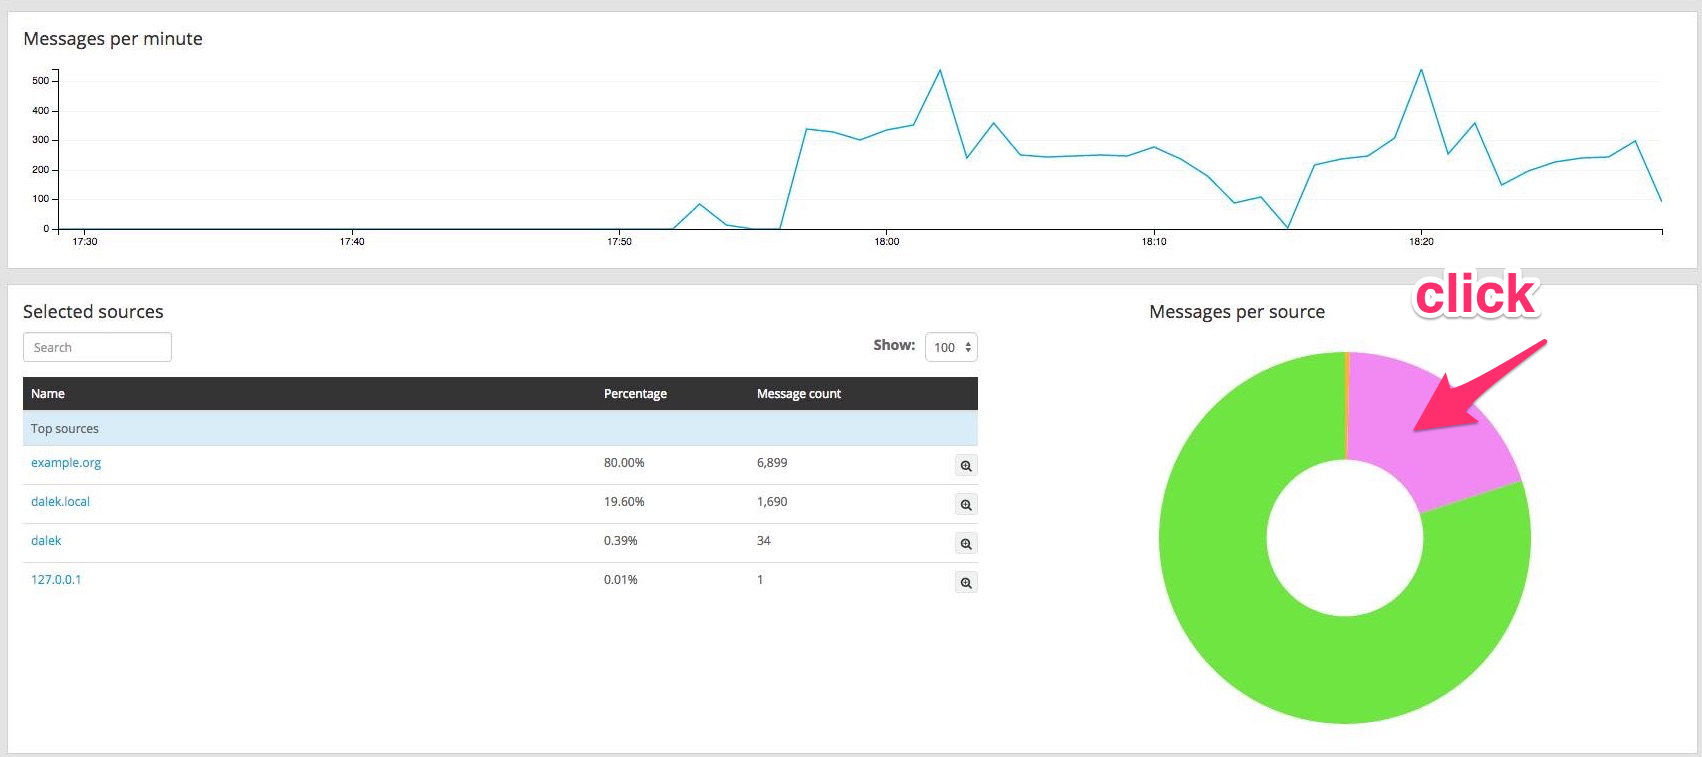
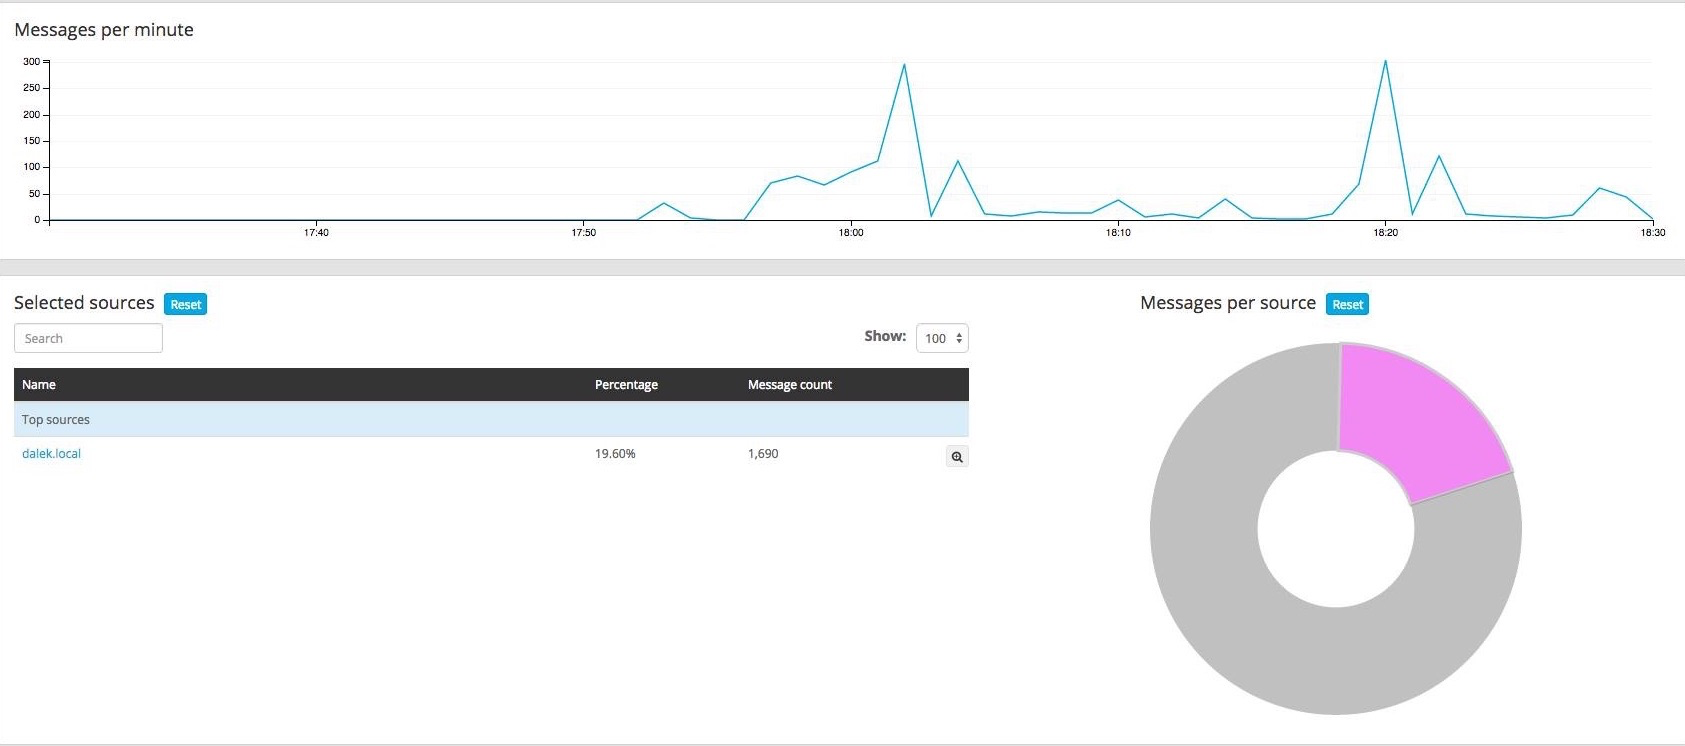
Inspiration: Interactive big data for logging with Graylog
Example Project:
Exploring all domestic US flights
for 2001

No specific task or question
Exploring what just might be interesting
Finding the unknown unknowns
The raw data
approx. 6 million data sets
> wc -l 2001.csv
5967781 2001.csv
approx. 600 MB of data
> ls -hl 2001.csv
573M Jan 10  2016 2001.csv
29 colums, data has gaps, but looks consistent
> head 2001.csv
Year,Month,DayofMonth,DayOfWeek,DepTime,CRSDepTime,ArrTime,CRSArrTime,UniqueCarrier,FlightNum,TailNum,ActualElapsedTime,CRSElapsedTime,AirTime,ArrDelay,DepDelay,Origin,Dest,Distance,TaxiIn,TaxiOut,Cancelled,CancellationCode,Diverted,CarrierDelay,WeatherDelay,NASDelay,SecurityDelay,LateAircraftDelay
2001,1,17,3,1806,1810,1931,1934,US,375,N700��,85,84,60,-3,-4,BWI,CLT,361,5,20,0,NA,0,NA,NA,NA,NA,NA
2001,1,18,4,1805,1810,1938,1934,US,375,N713��,93,84,64,4,-5,BWI,CLT,361,9,20,0,NA,0,NA,NA,NA,NA,NA
2001,1,19,5,1821,1810,1957,1934,US,375,N702��,96,84,80,23,11,BWI,CLT,361,6,10,0,NA,0,NA,NA,NA,NA,NA
2001,1,20,6,1807,1810,1944,1934,US,375,N701��,97,84,66,10,-3,BWI,CLT,361,4,27,0,NA,0,NA,NA,NA,NA,NA
Does this at all qualify as big data?
Certainly no challenge in storing
Big Data in the sense of: too big for Excel or RAM, hard to process
Challenge
What tools do you use to explore that data and give it value?
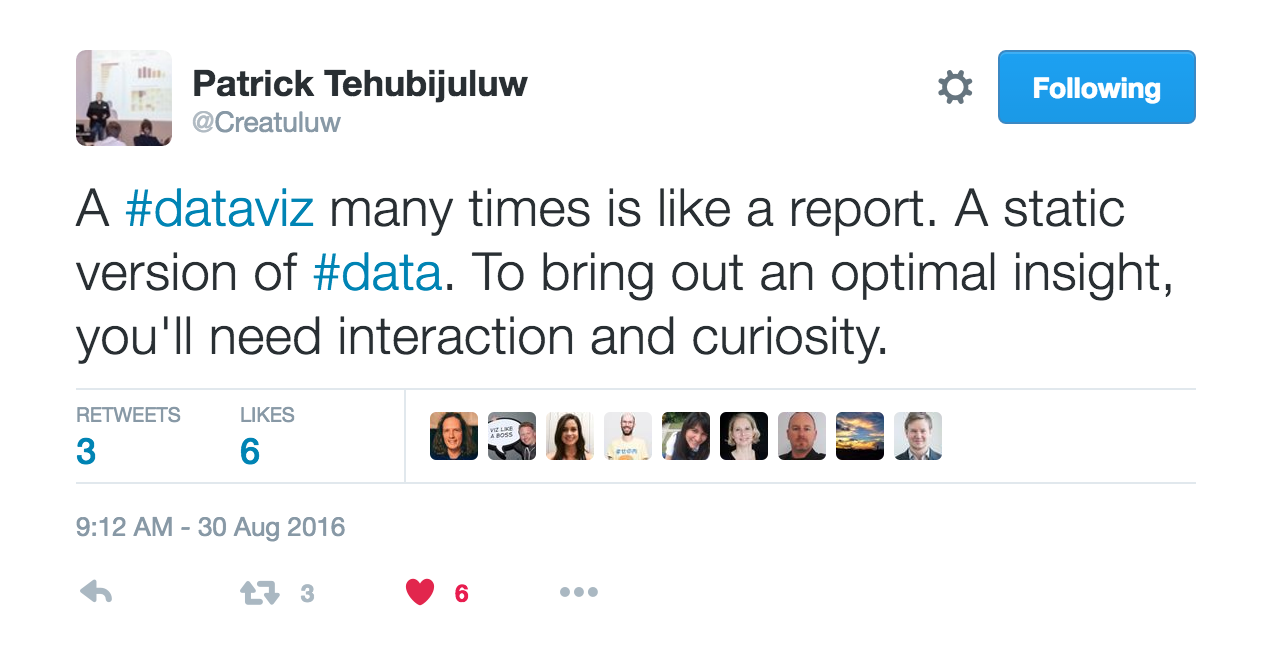
Try showing your #data from another perspective with #dataviz

But why in the Browser
1: Zero-Installation for the user
2: Available on almost every device
3: Interactivity comes naturally
Best to bring the data to the domain expert with minimal hassle
Options for Tools
- Google Sheets
- Elasticsearch / Kibana (ELK)
- D3 with crossfilter and DC
- D3 loading Segments from ELK
- (Jupyter/iPython Notebooks)
I: Google Sheets
Import
Up to 2 million cells
We have 9 * 400,000: too many for Google Sheets
> cut -f2,3,4,5,6,7,8,9 -d, 09.csv >09_no_month.csv
> awk -F, '$1 >= 10 && $1 <= 15' 09_no_month.csv > 09_very_small.csv
> ls -lh 09_very_small.csv
-rw-r--r--  1 olli  staff   1.0M Jul 21 21:46 09_very_small.csv
> wc -l 09_very_small.csv
38272 09_very_small.csv
Other Standard tools
- Excel (2011 Mac): truncates
- loads data relatively fast
- truncates after 1M lines
- Google Sheets: nope
- limited to 2.000.000 cells (not lines)
- does not load data at all
- Numbers (Mac): truncates
- loading takes long
- truncates after 64k lines
- Emacs: Low-level operations possible
- loads data very fast with almost no memory overhead
- all operations work smoothly, even editing and saving
Filters
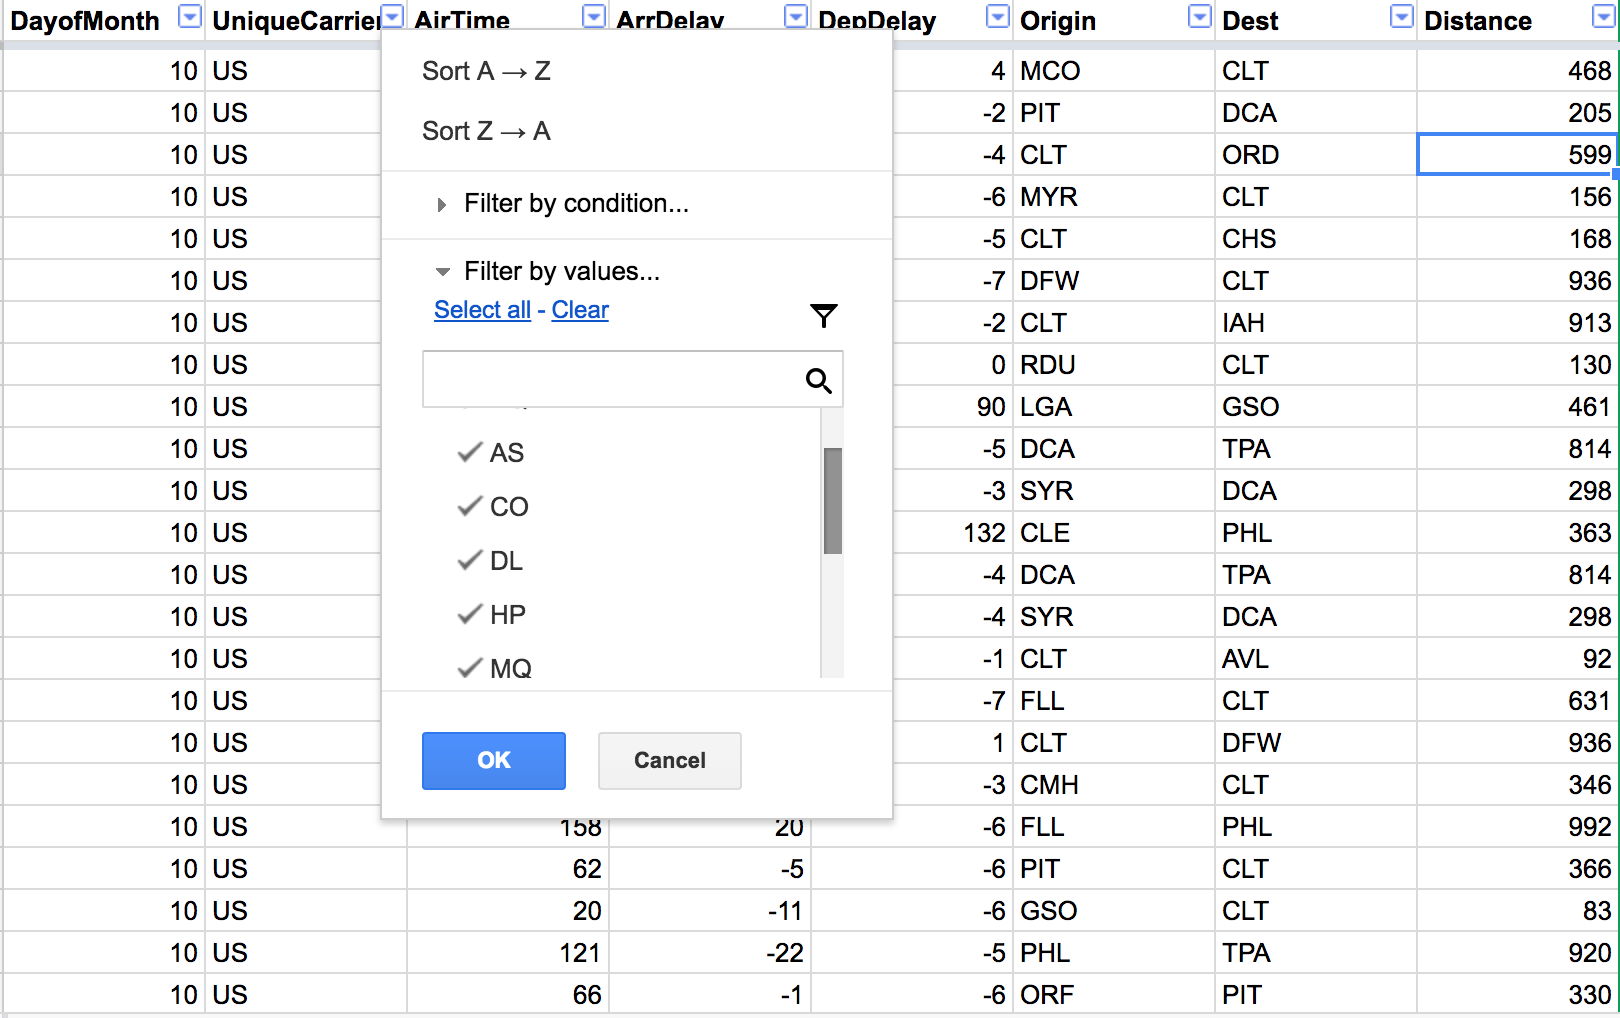
Physically change the data, just one possible
Filters Views
Just a view on the data, more than one possible
Departure Delay > 200 minutes
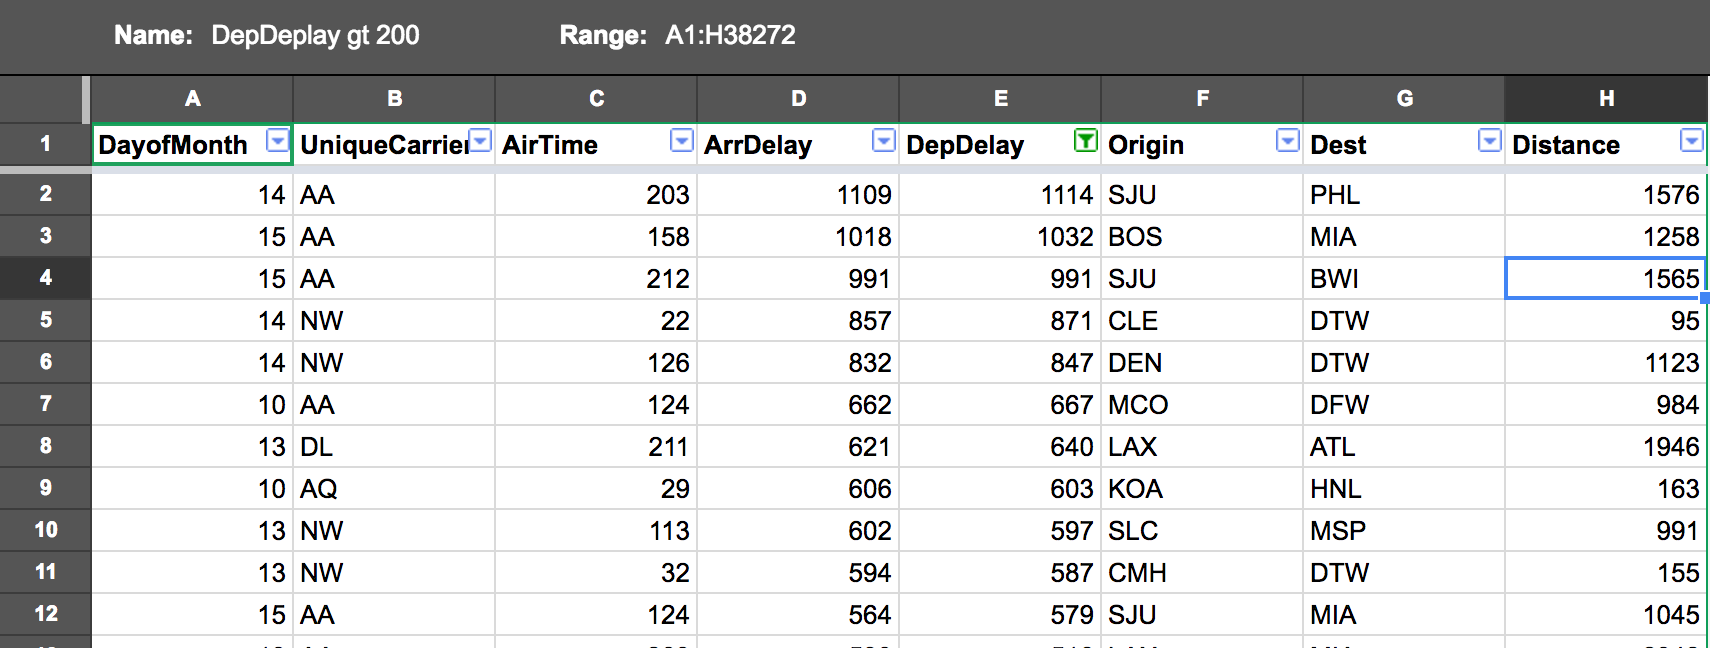
Can already be used for interactive data exploration ...
... even possible without logging in (for you)
Demo: Creating a filter view
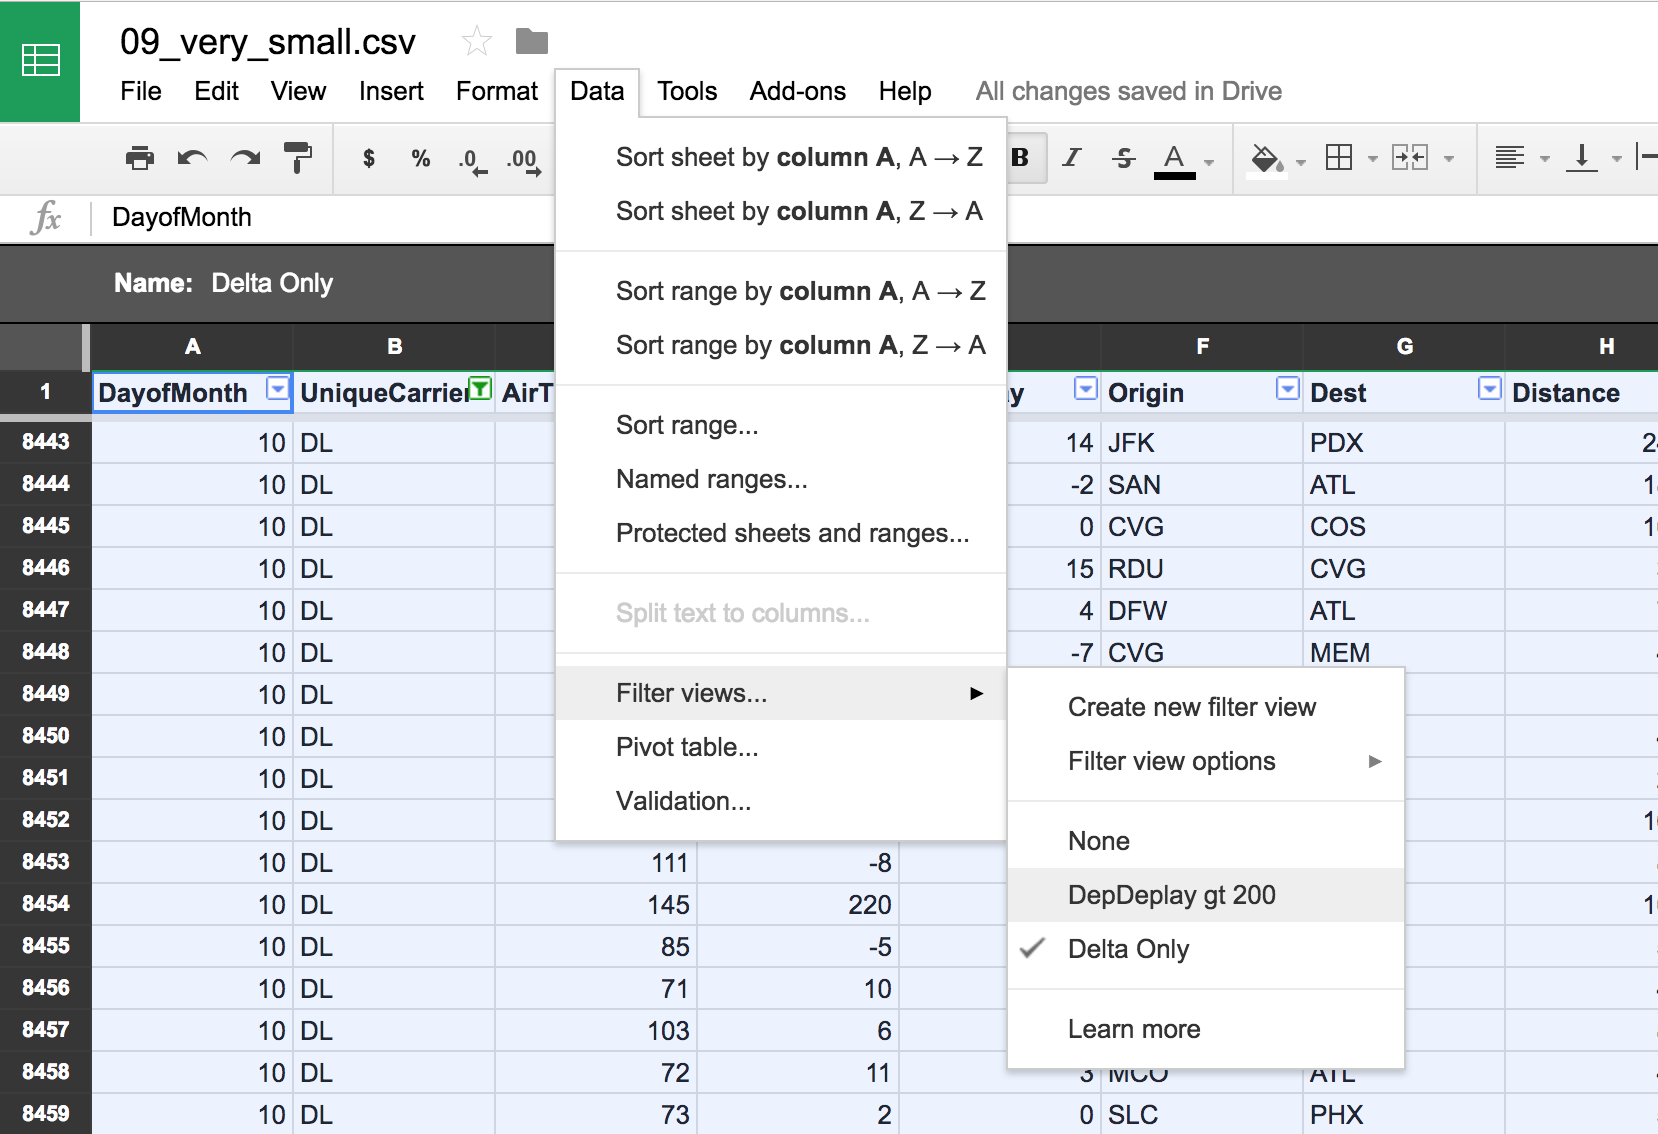
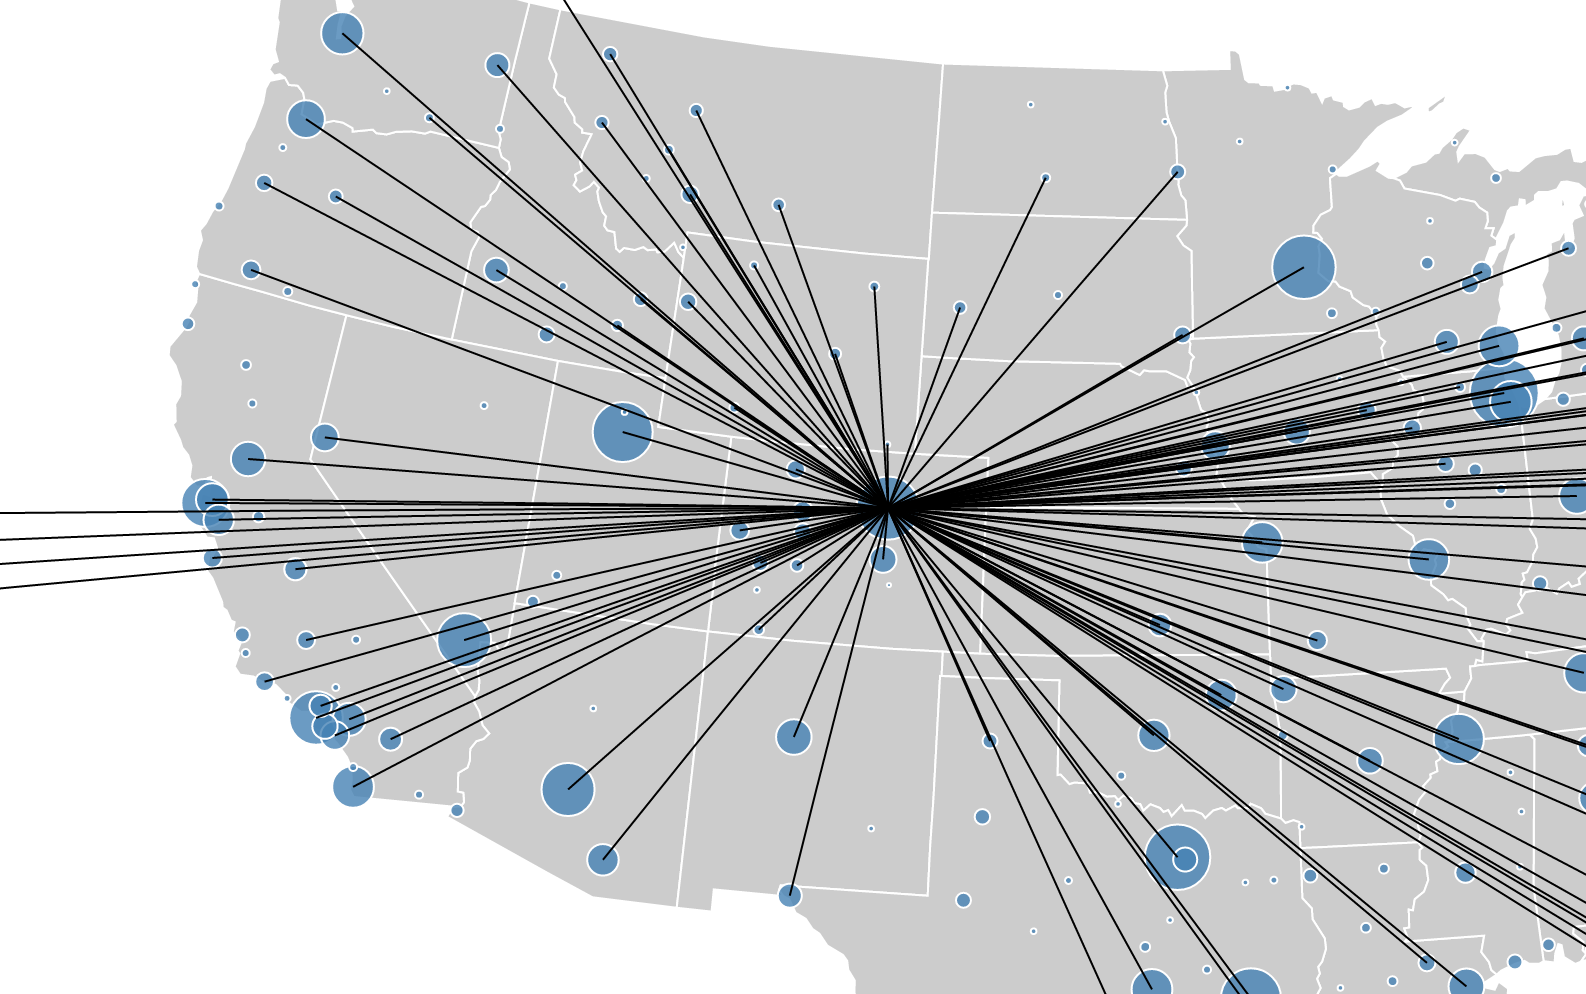
Origins of Delta flights to STL
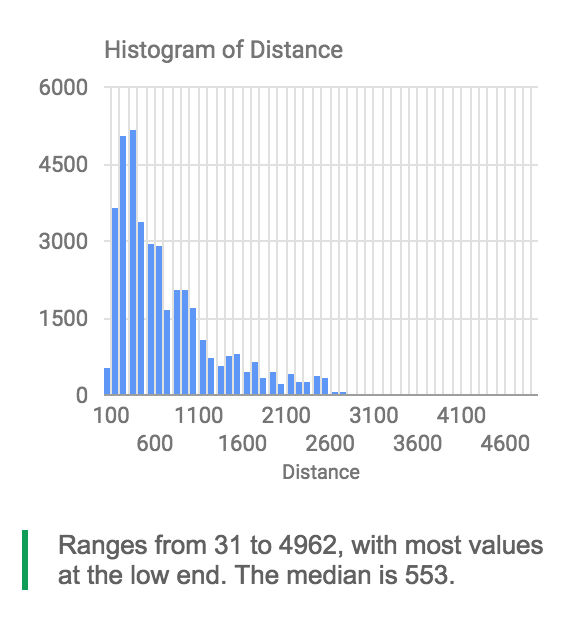
Diagram
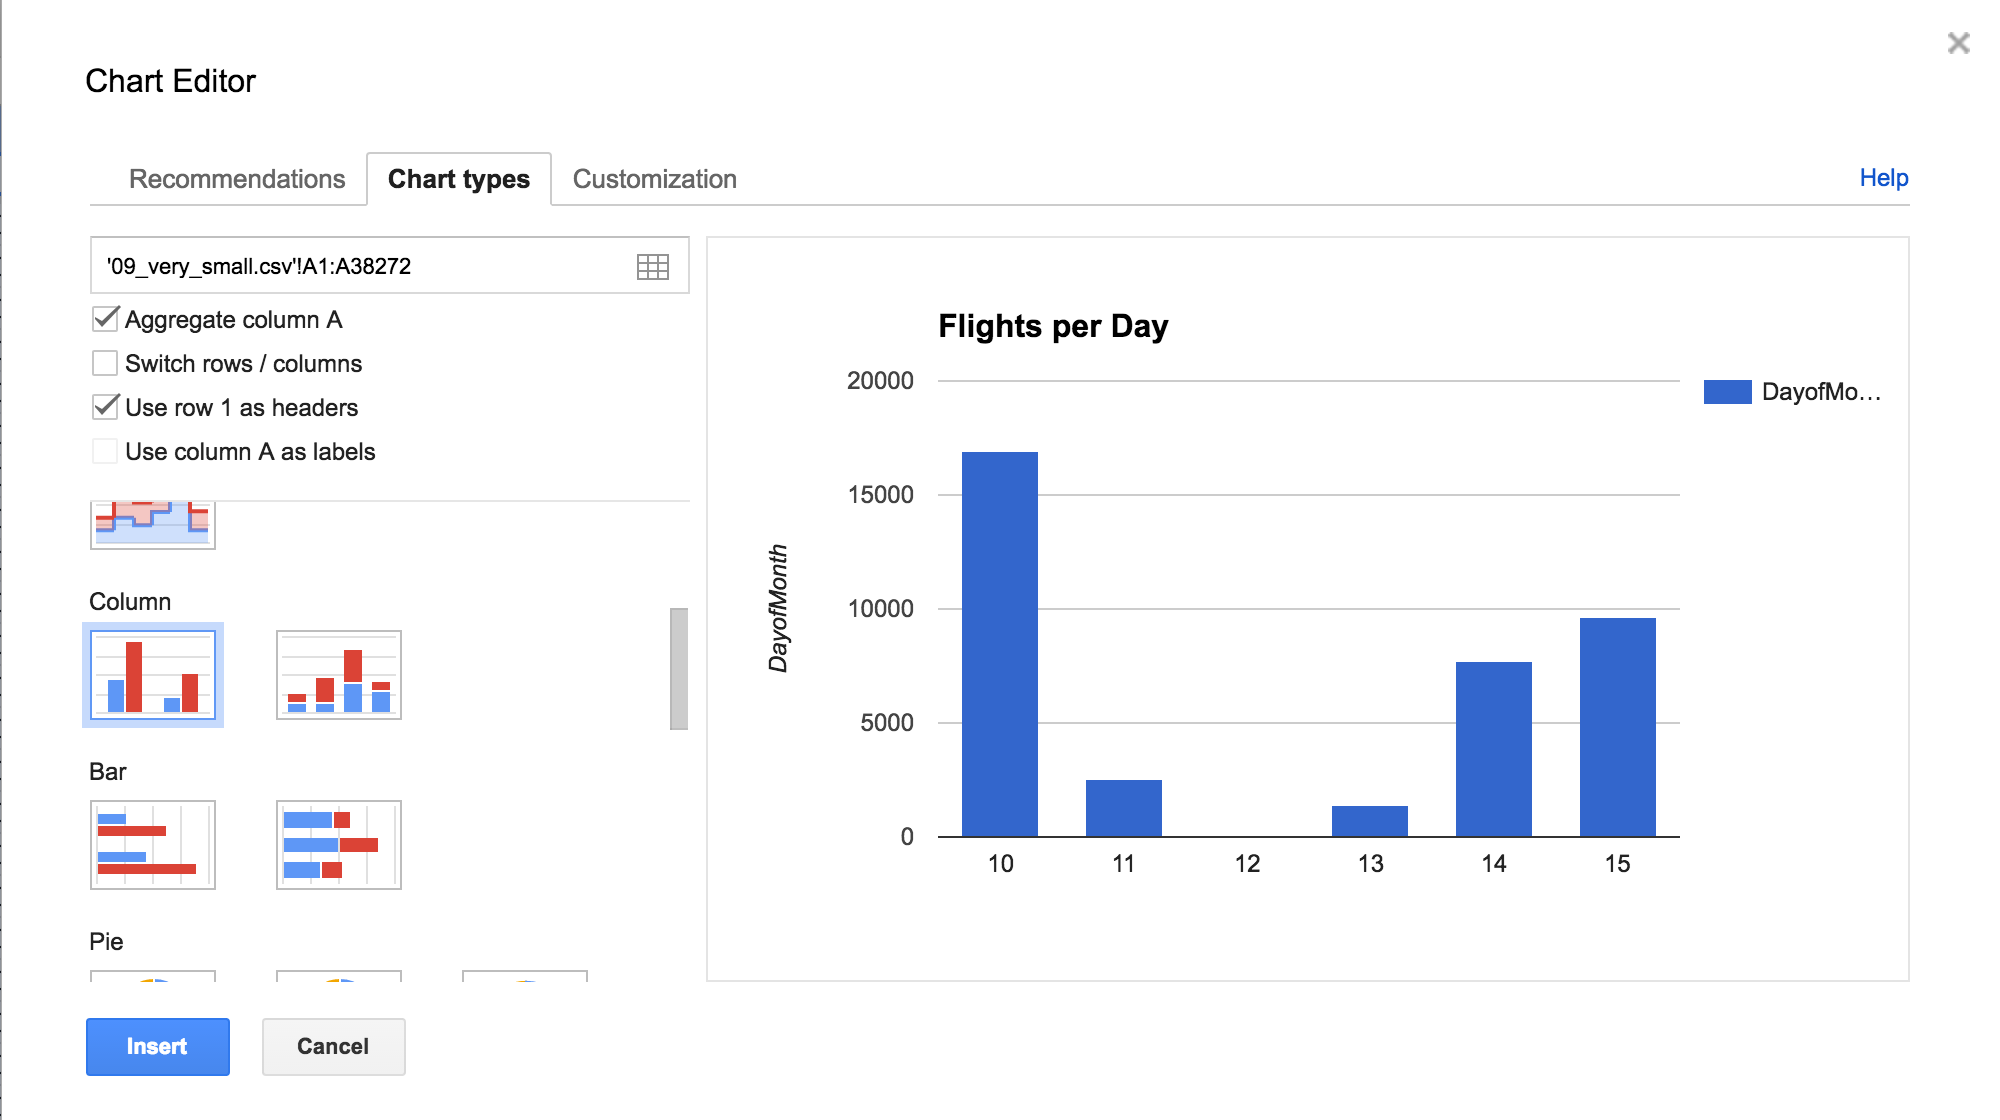
How many flights per day?
Mini Dashboard
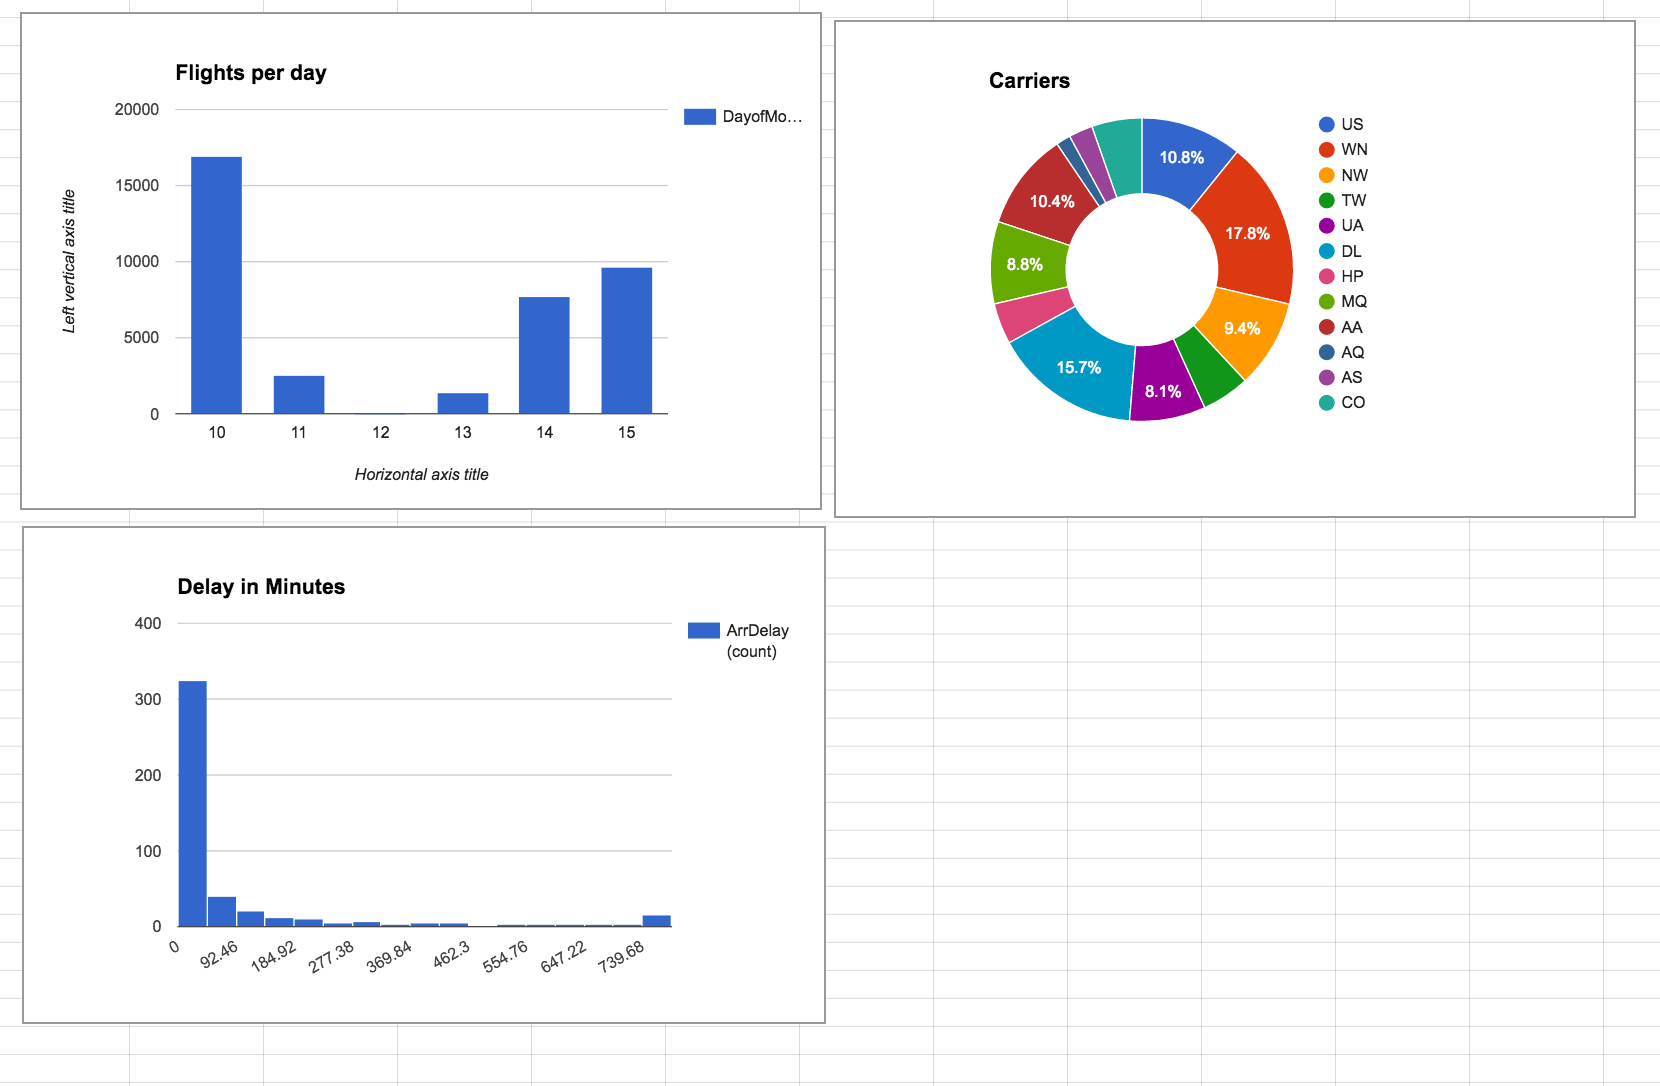
flights per day / carriers / delay
Explore
The best is yet to come

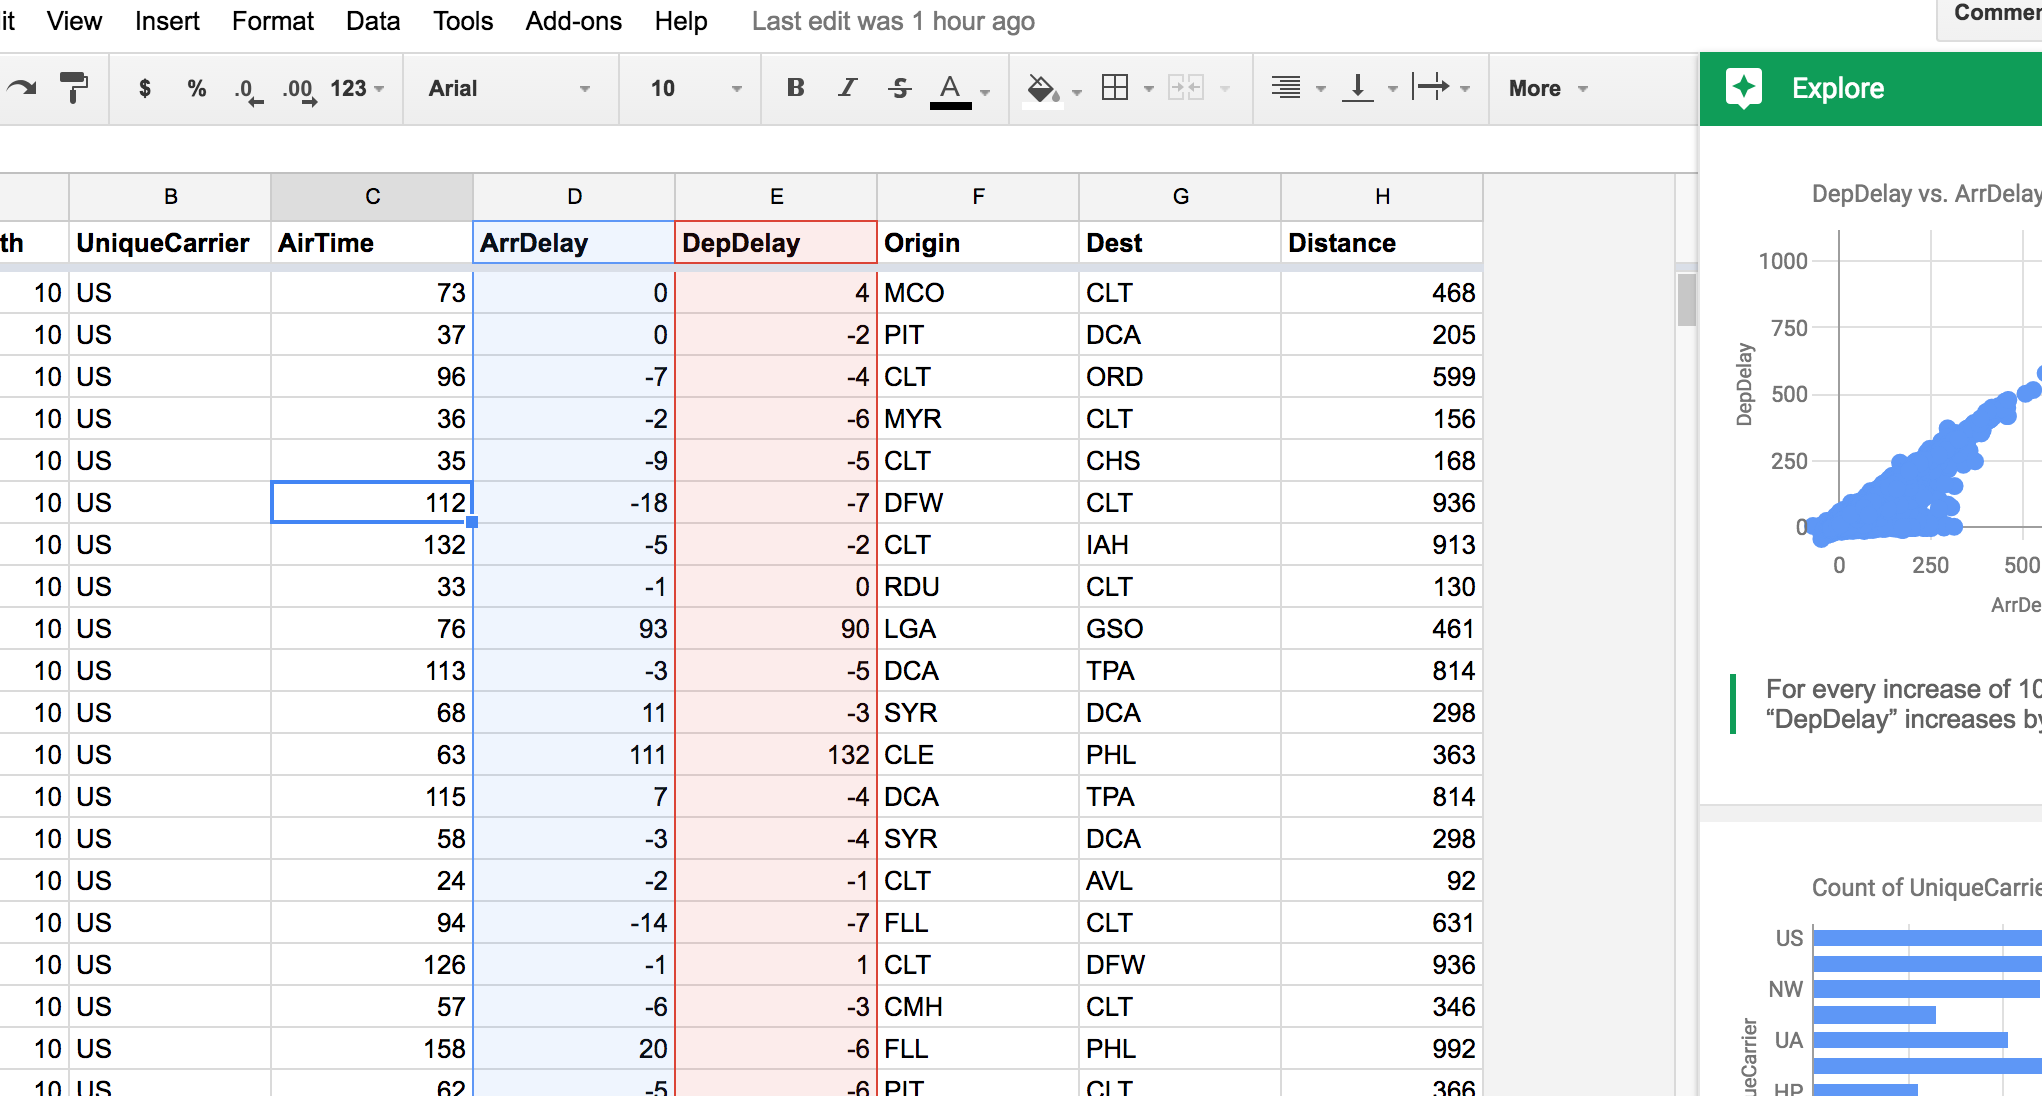
After quite some time, you get this:
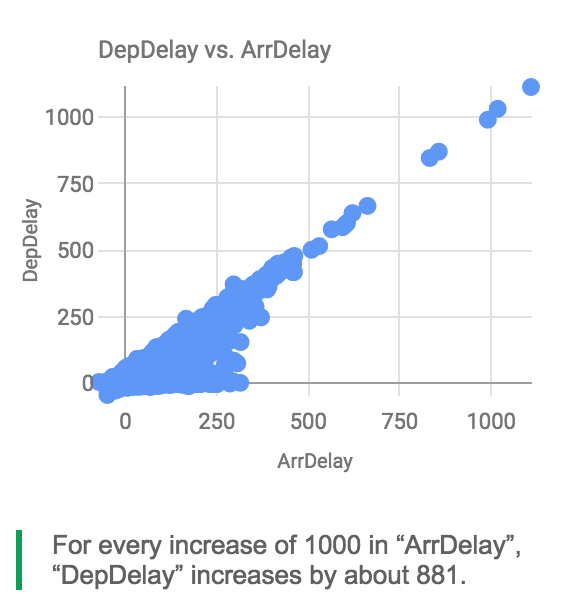
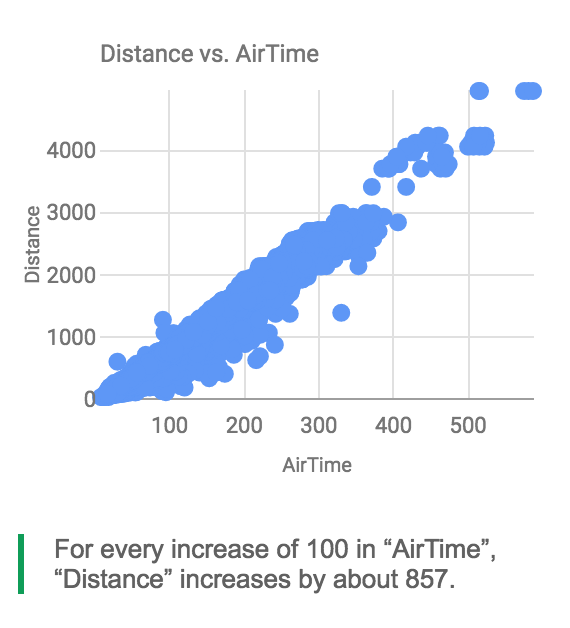
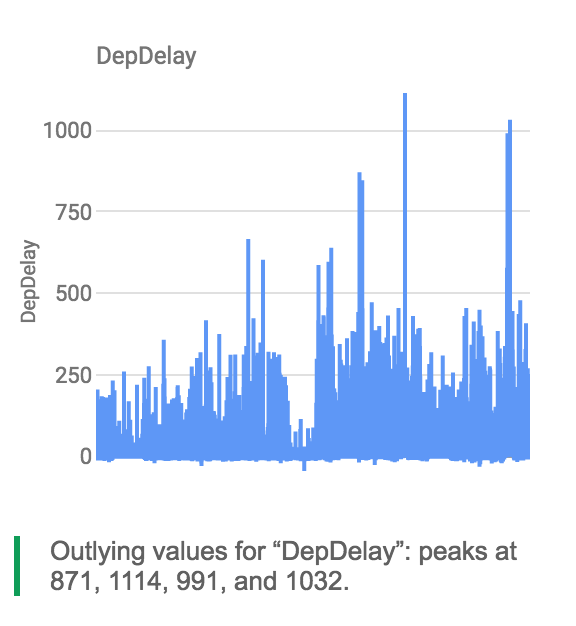
Correlations, Outliers, etc.
Sheets can automatically find this
II: D3 with crossfilter and DC
Things get more interactive and connected
Using full data set of September (10x the data)
D3.js: Dynamic graphics in the browser
Data based vector graphics (SVG)
Crossfilter: Filtering millions of data sets in real time
- http://square.github.io/crossfilter/
- Can filter up to millions of data sets in real time in the browser
- Data sets are indexed when loaded
- You specify what you want to filter using dimensions
dc.js: Charting with D3 and Crossfilter
- http://dc-js.github.io/dc.js/
- Prebuilt integration of D3 and Crossfilter
- offers a couple of diagram types that are useful for interactive big data
- bar
- pie
- many more
Initial Design
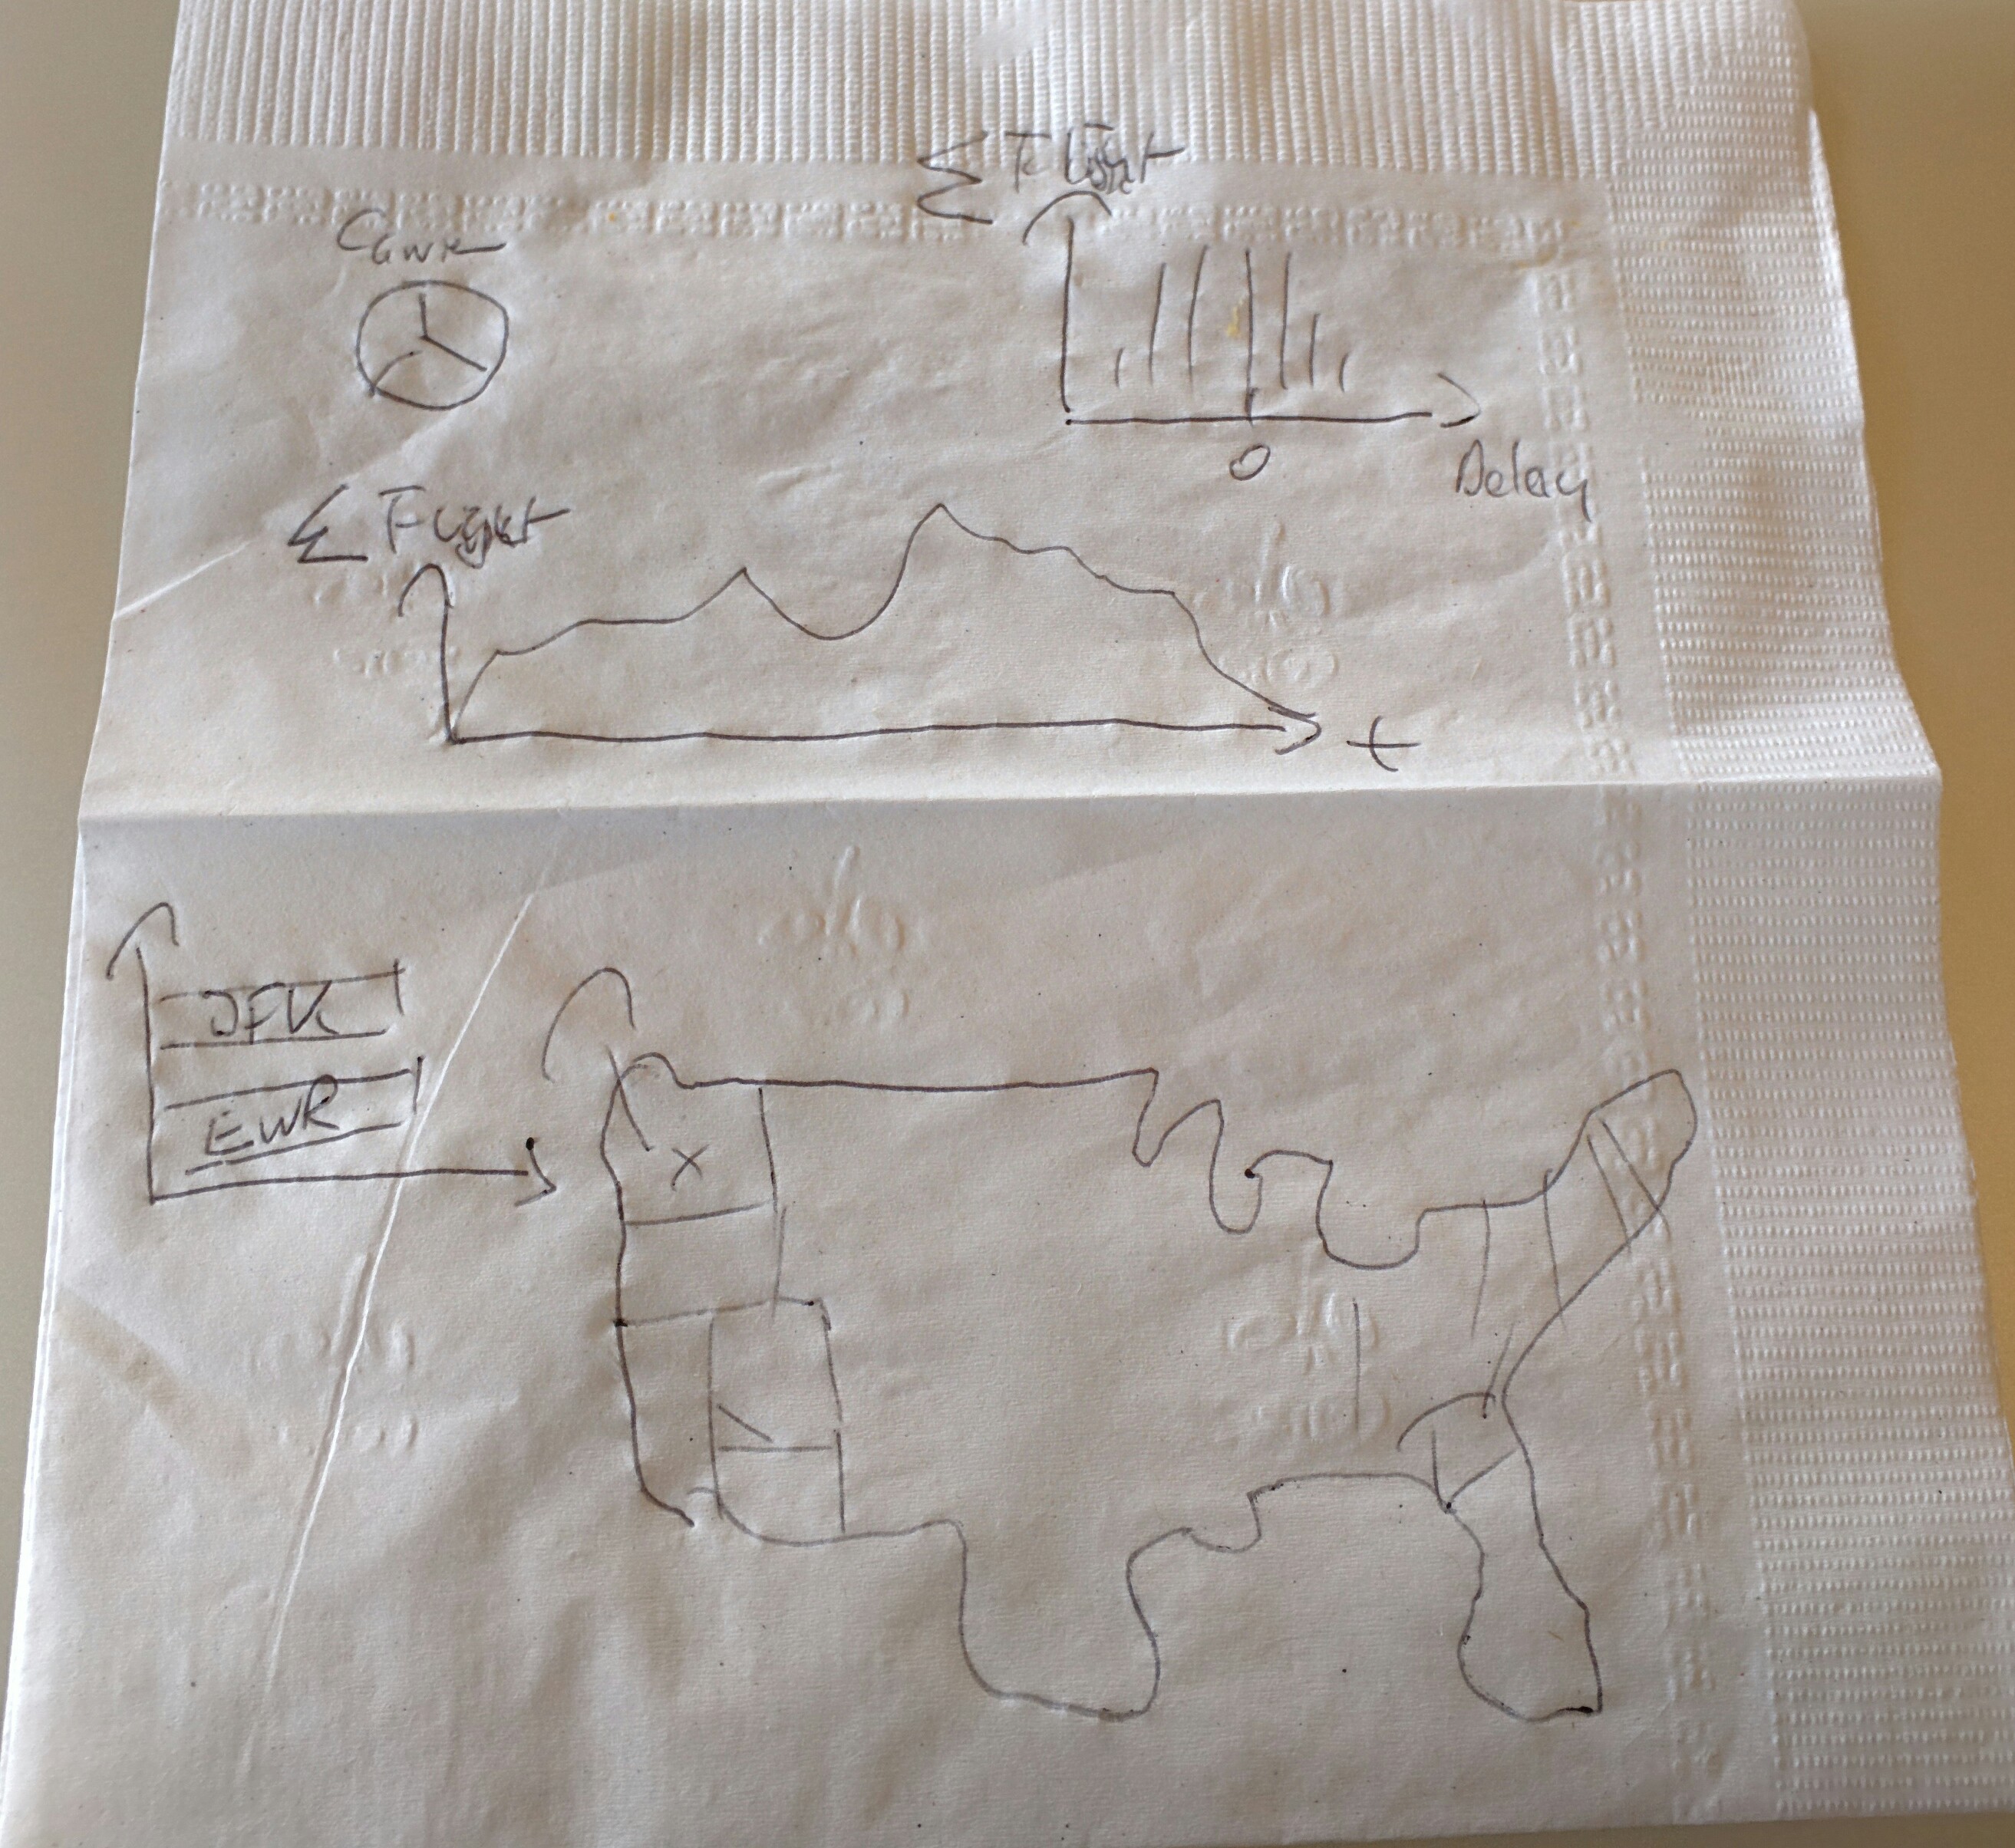
Introducing sophisticated and responsive Widgets
Demo: Implementation using a static dump of September
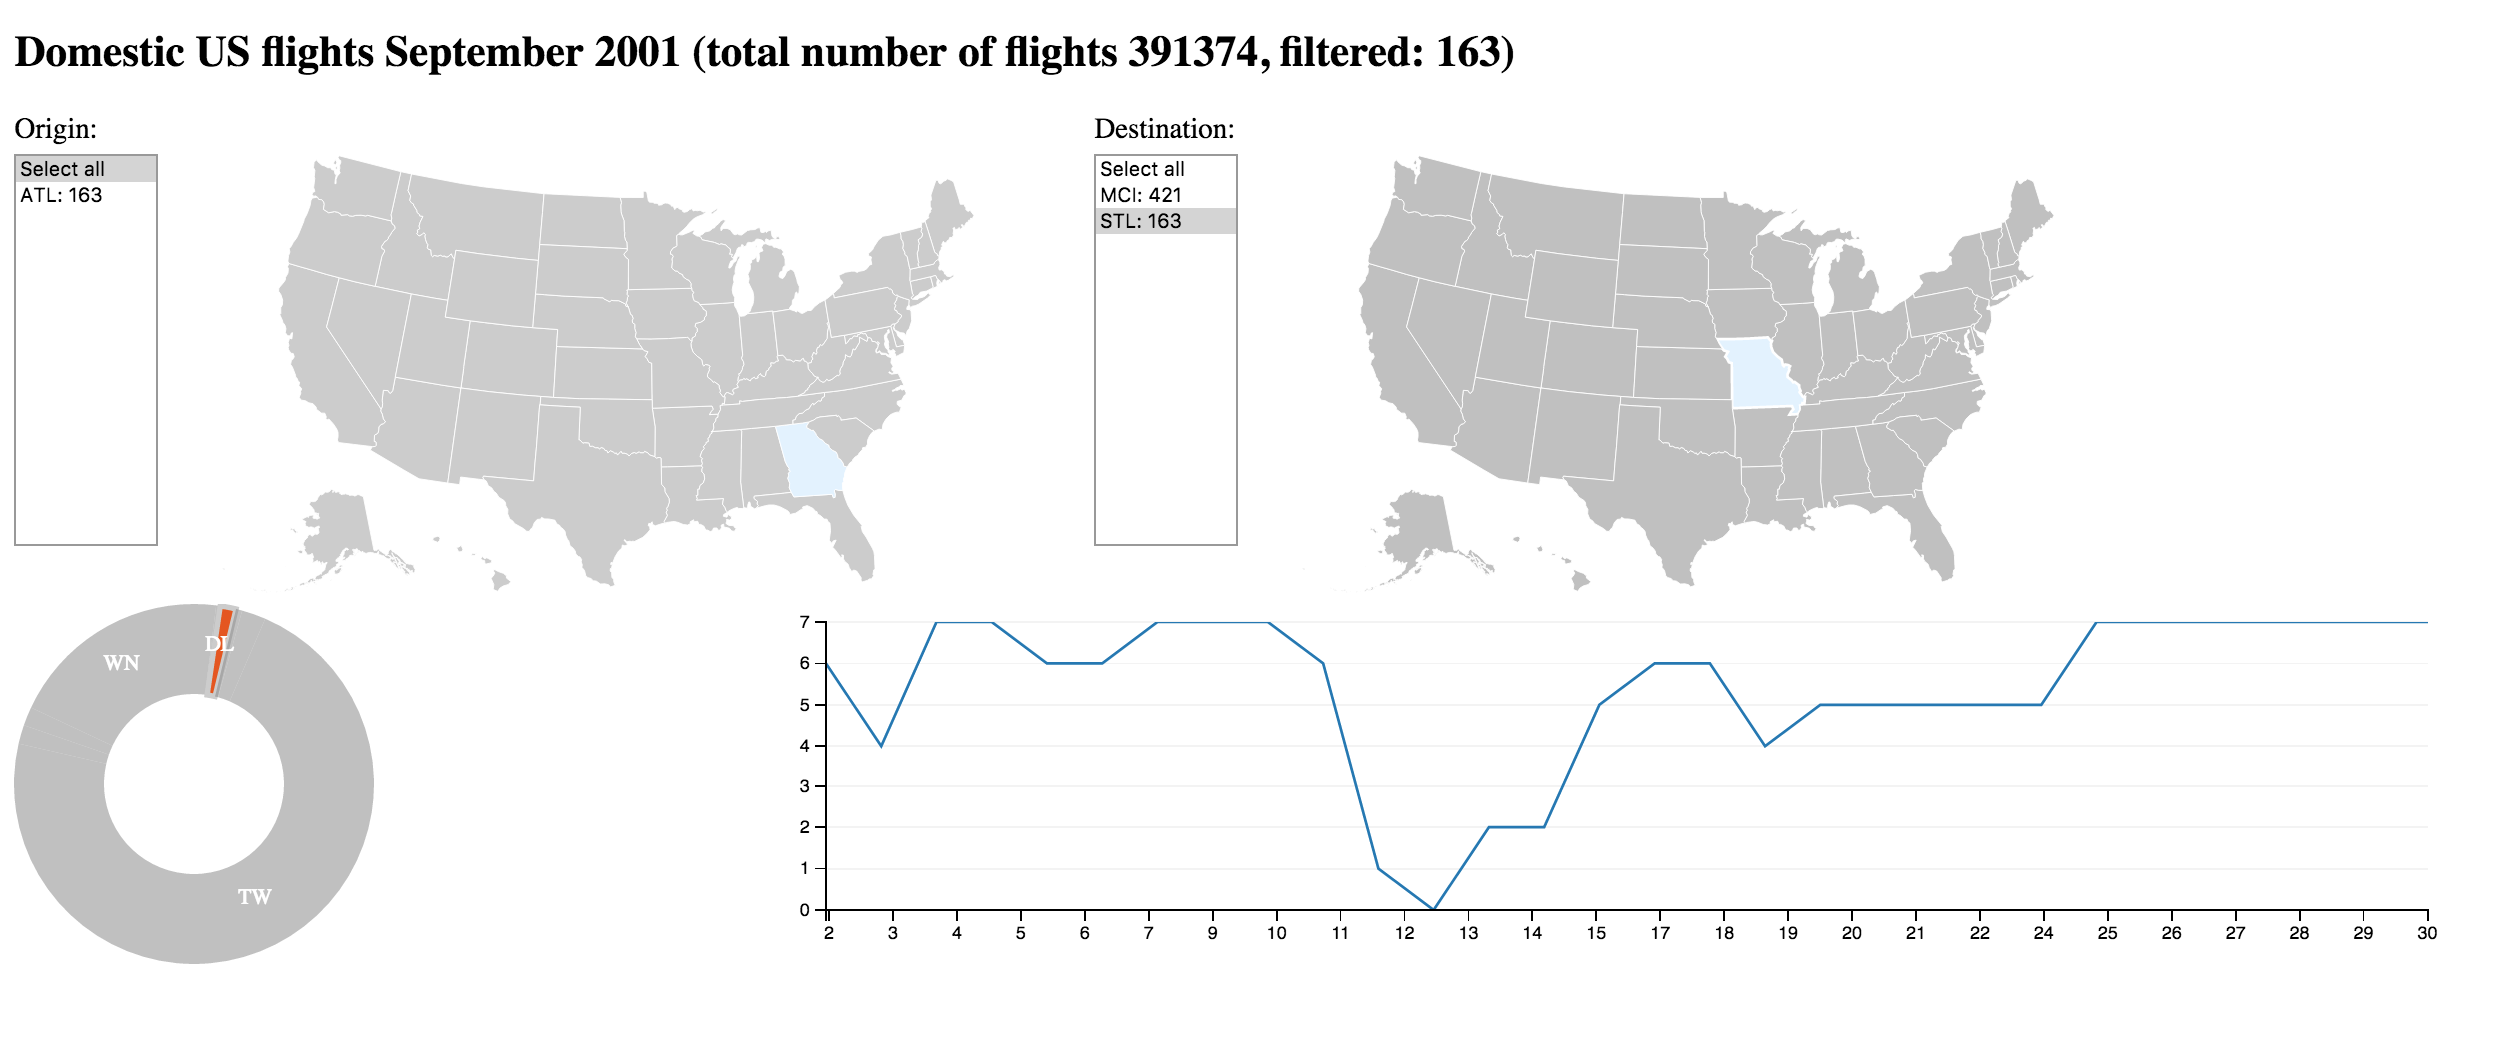
Again: Origins of Delta flights to STL
JavaScript Code Sample: creating the pie chart
var pieChartCarriers = dc.pieChart("#pie");
pieChartCarriers
        .slicesCap(5)
        .dimension(carrier)
        .group(carrier.group().reduceCount());
Not very hard, but definitely requires programming skills
III: ELK
Things scale
Using all of 2001 (once more 10x the data)
Data needs to be (physically) close to the interaction to make it fast and thus most useful
ELK Stack
- Elasticsearch
- Search and Analytics Engine
- Indexes and stores structured or unstructured data
- Offers query language to search or aggregate data
- Logstash
- process data and store into Elasticsearch
- Ruby based import description
- Kibana
- interactive querying
- visualization (in dashboards)
Kibana
- generic frontend for Elasticsearch
- browser based
- allows for dashboards
- also allows to make arbitrary adhoc queries
Discover Data
using Kibana adhoc queries
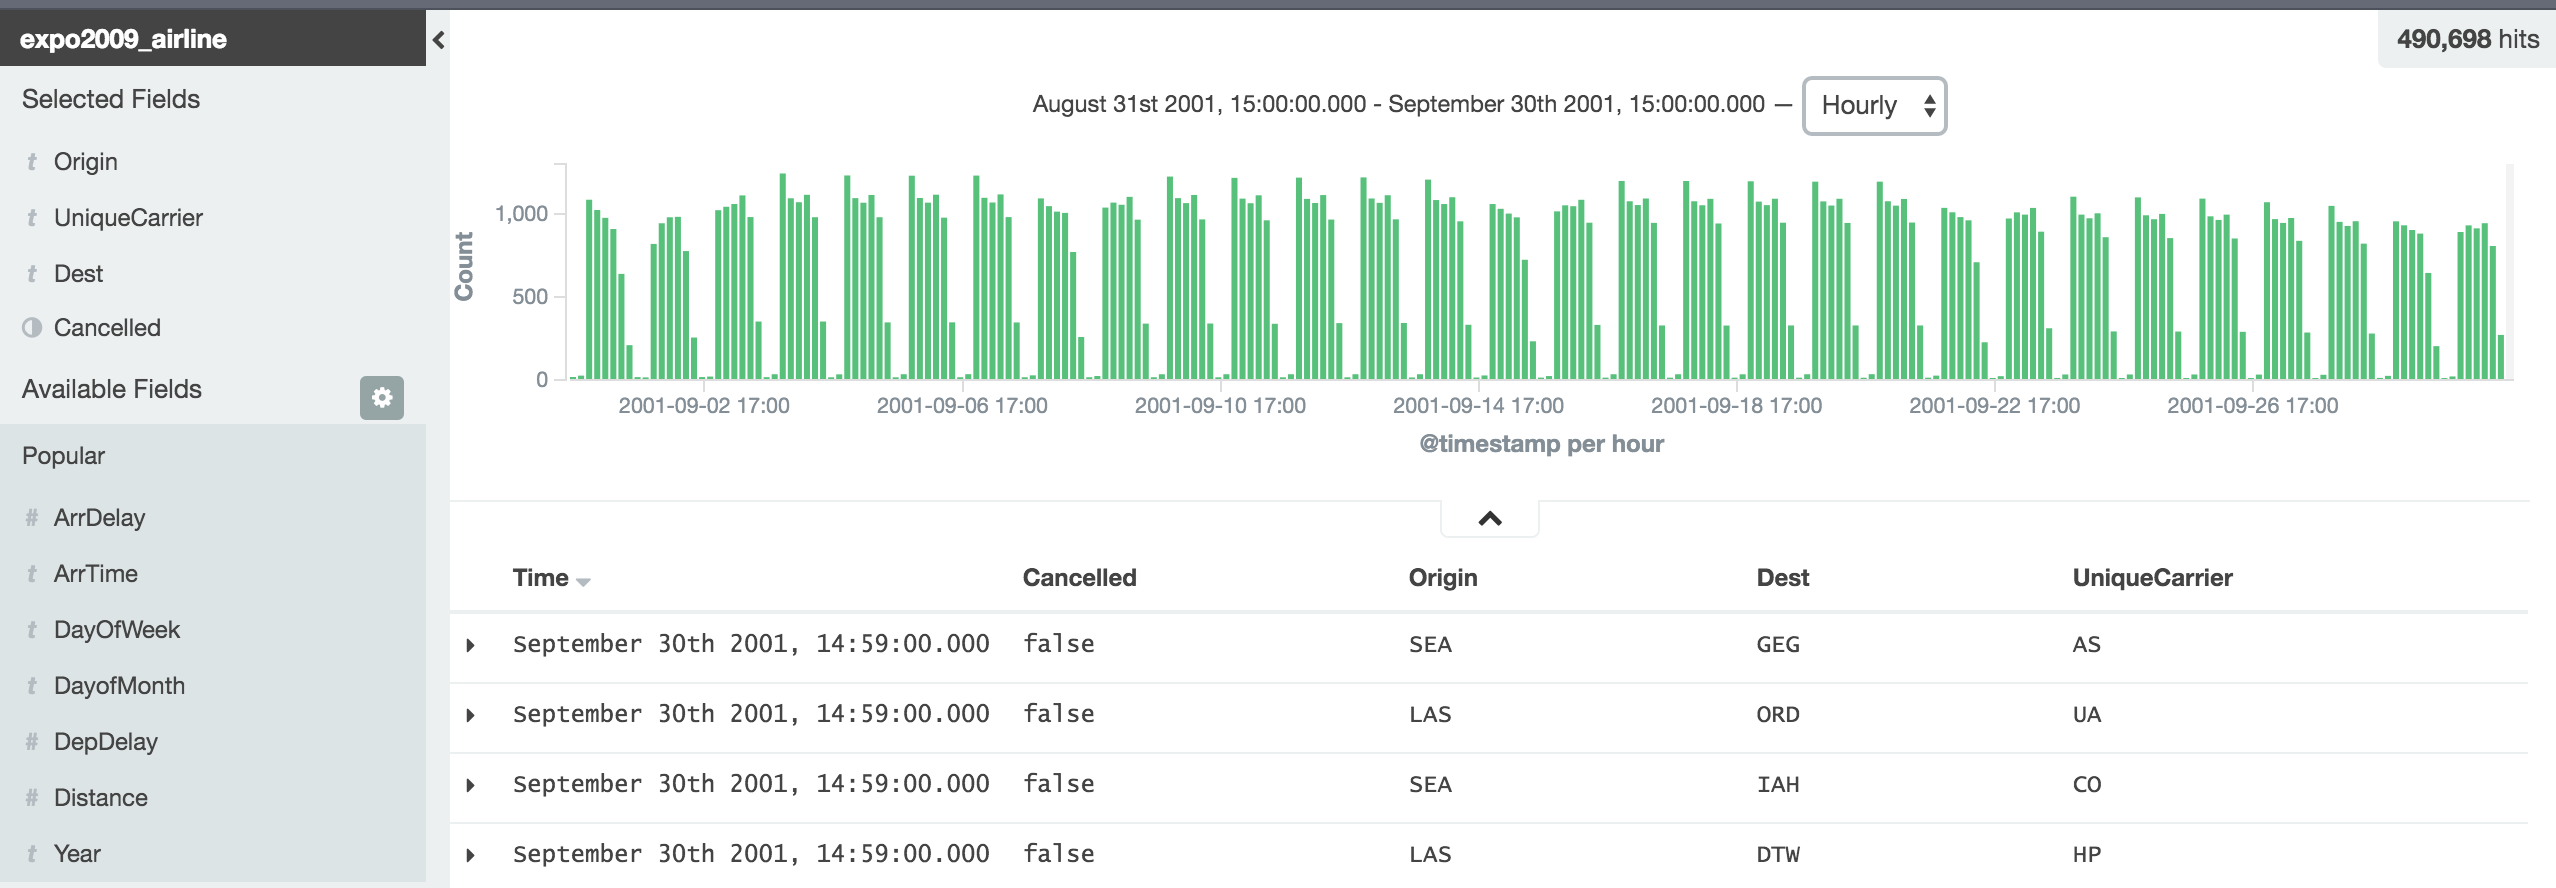
Demo: filter for 'Cancelled:false'
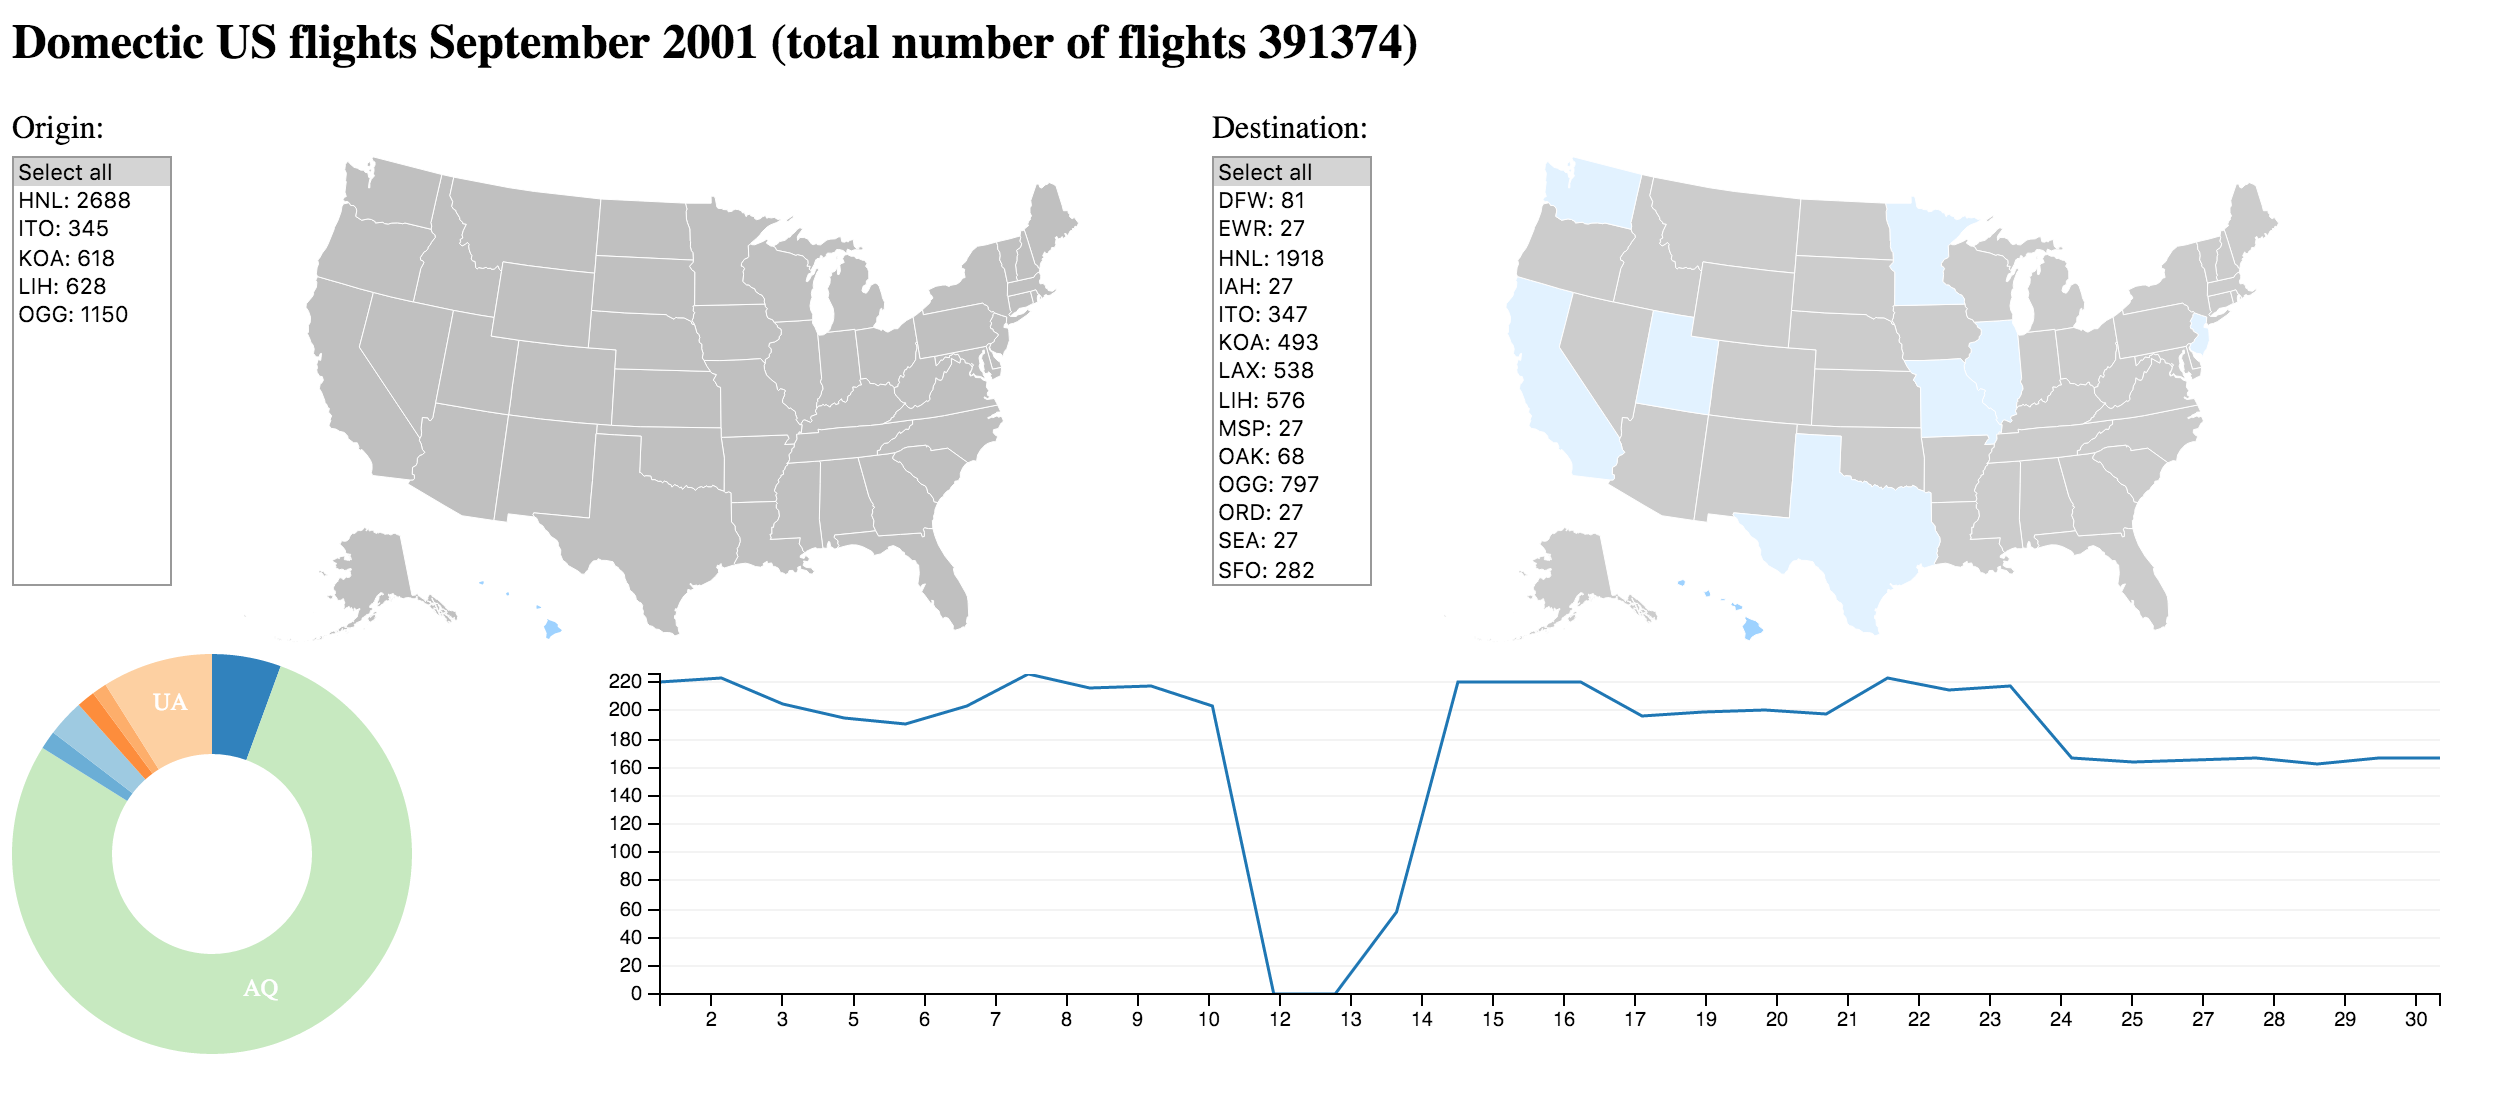
Demo: Flights Dashboard
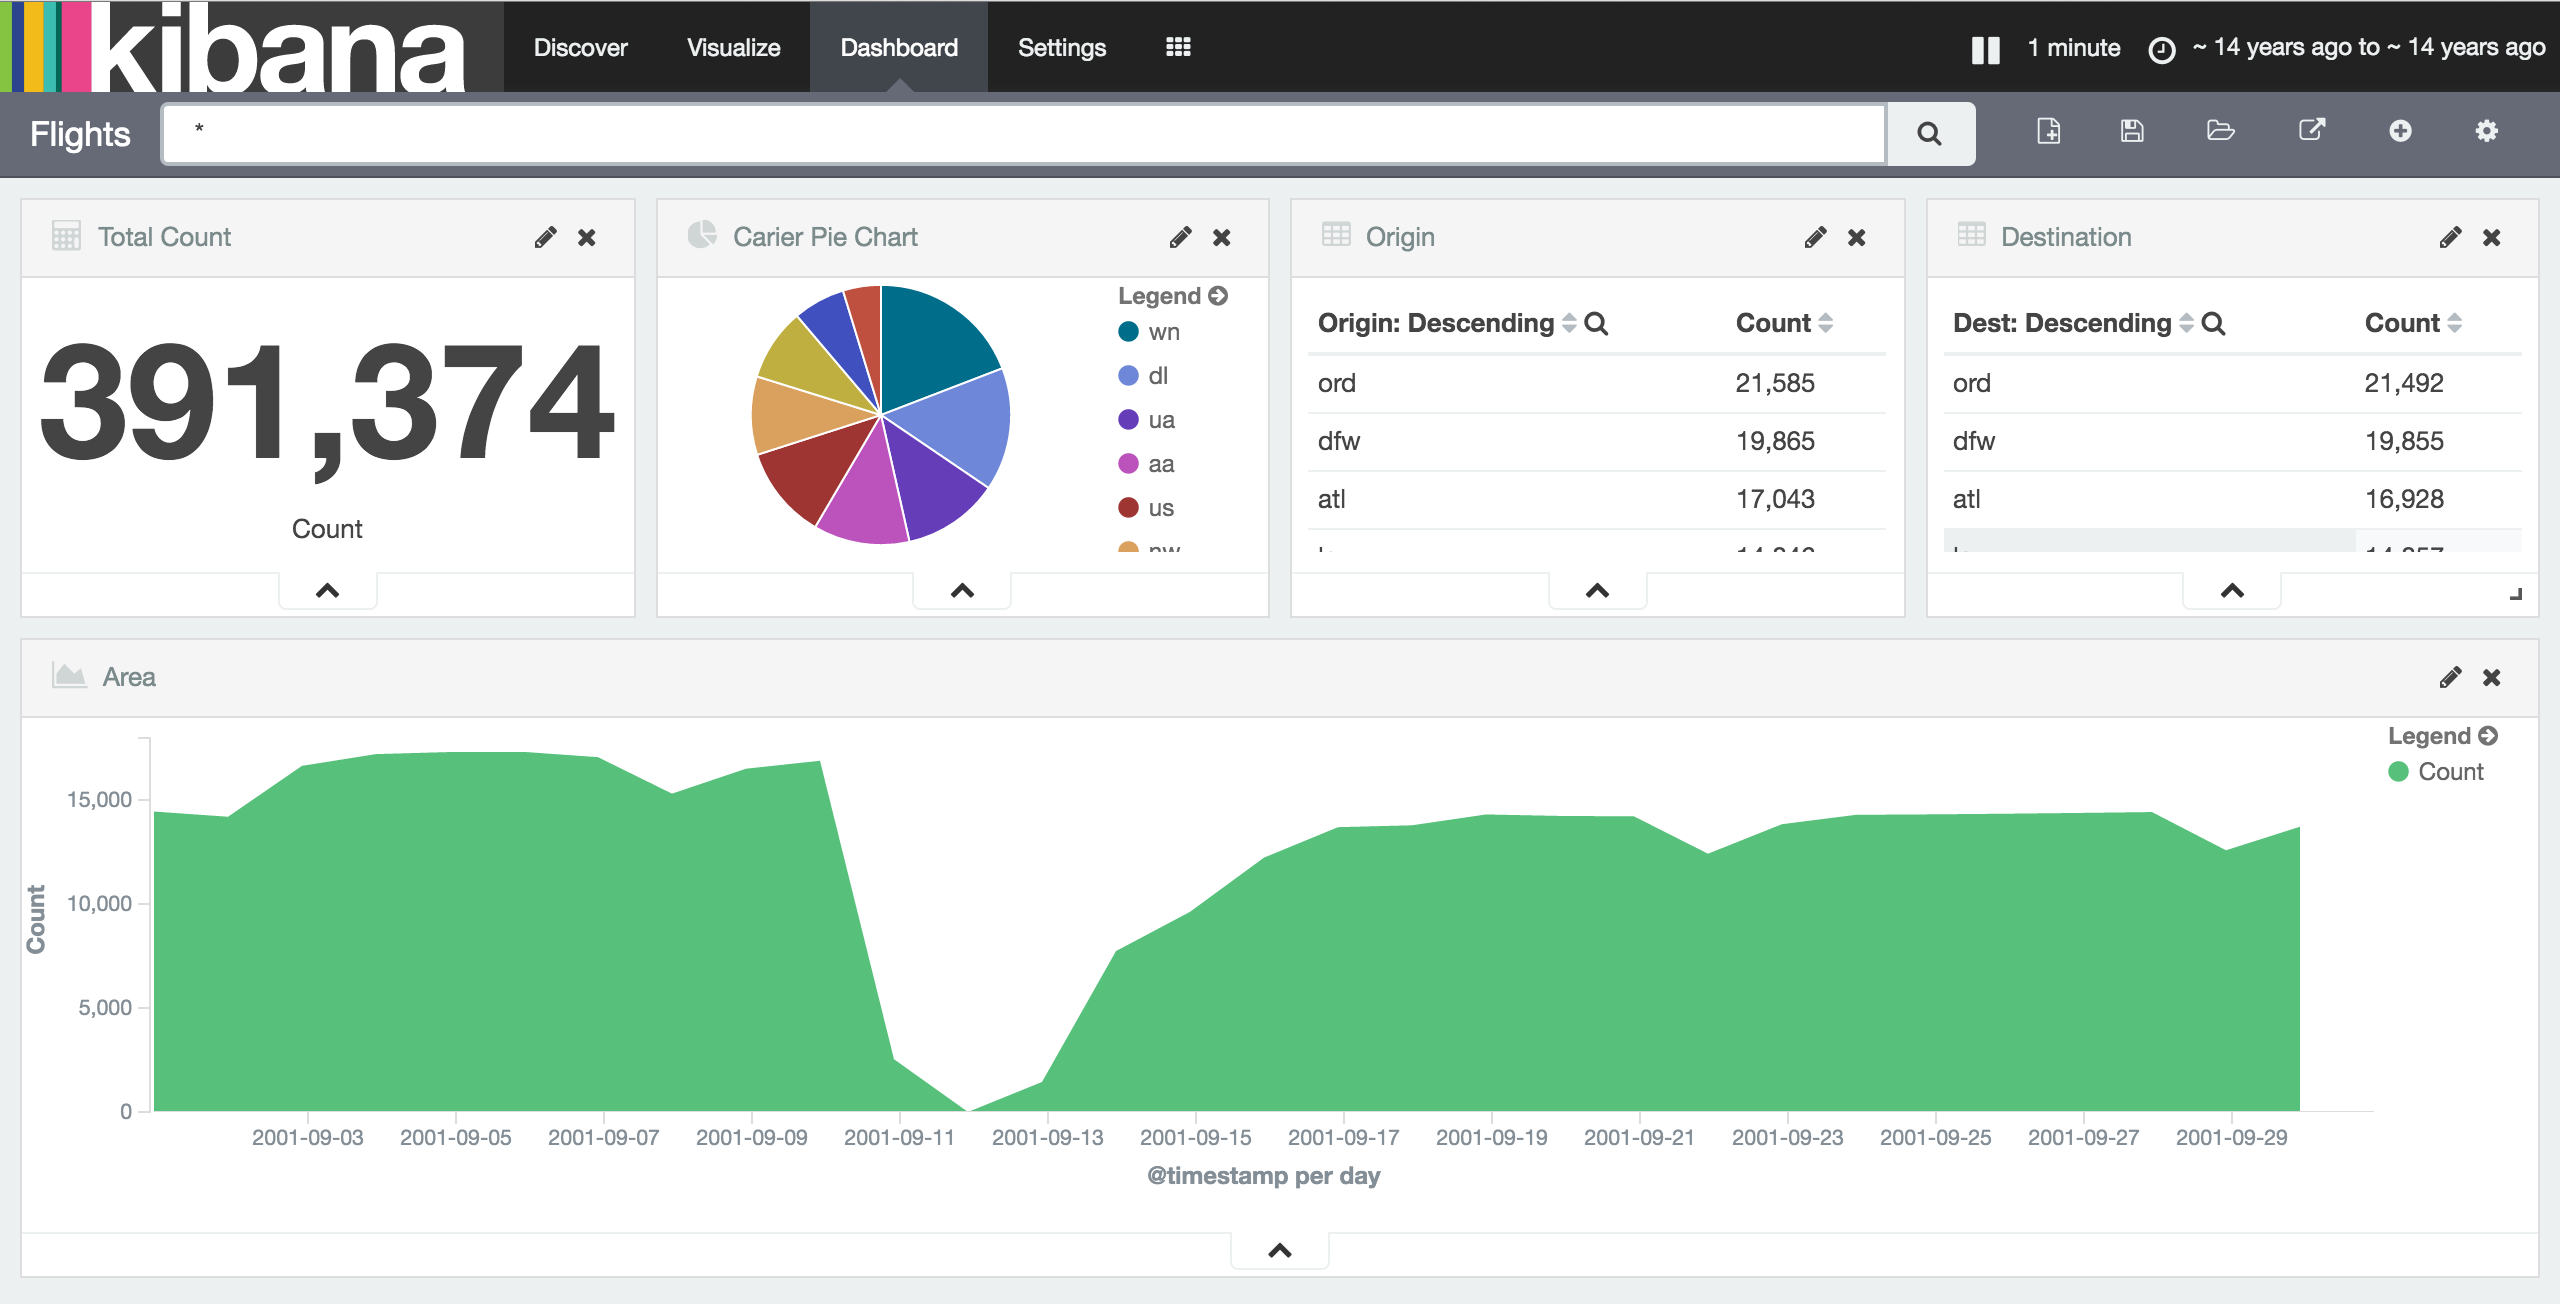
Clicks trigger requests, responses update graphics
Again: Origins of Delta flights to STL
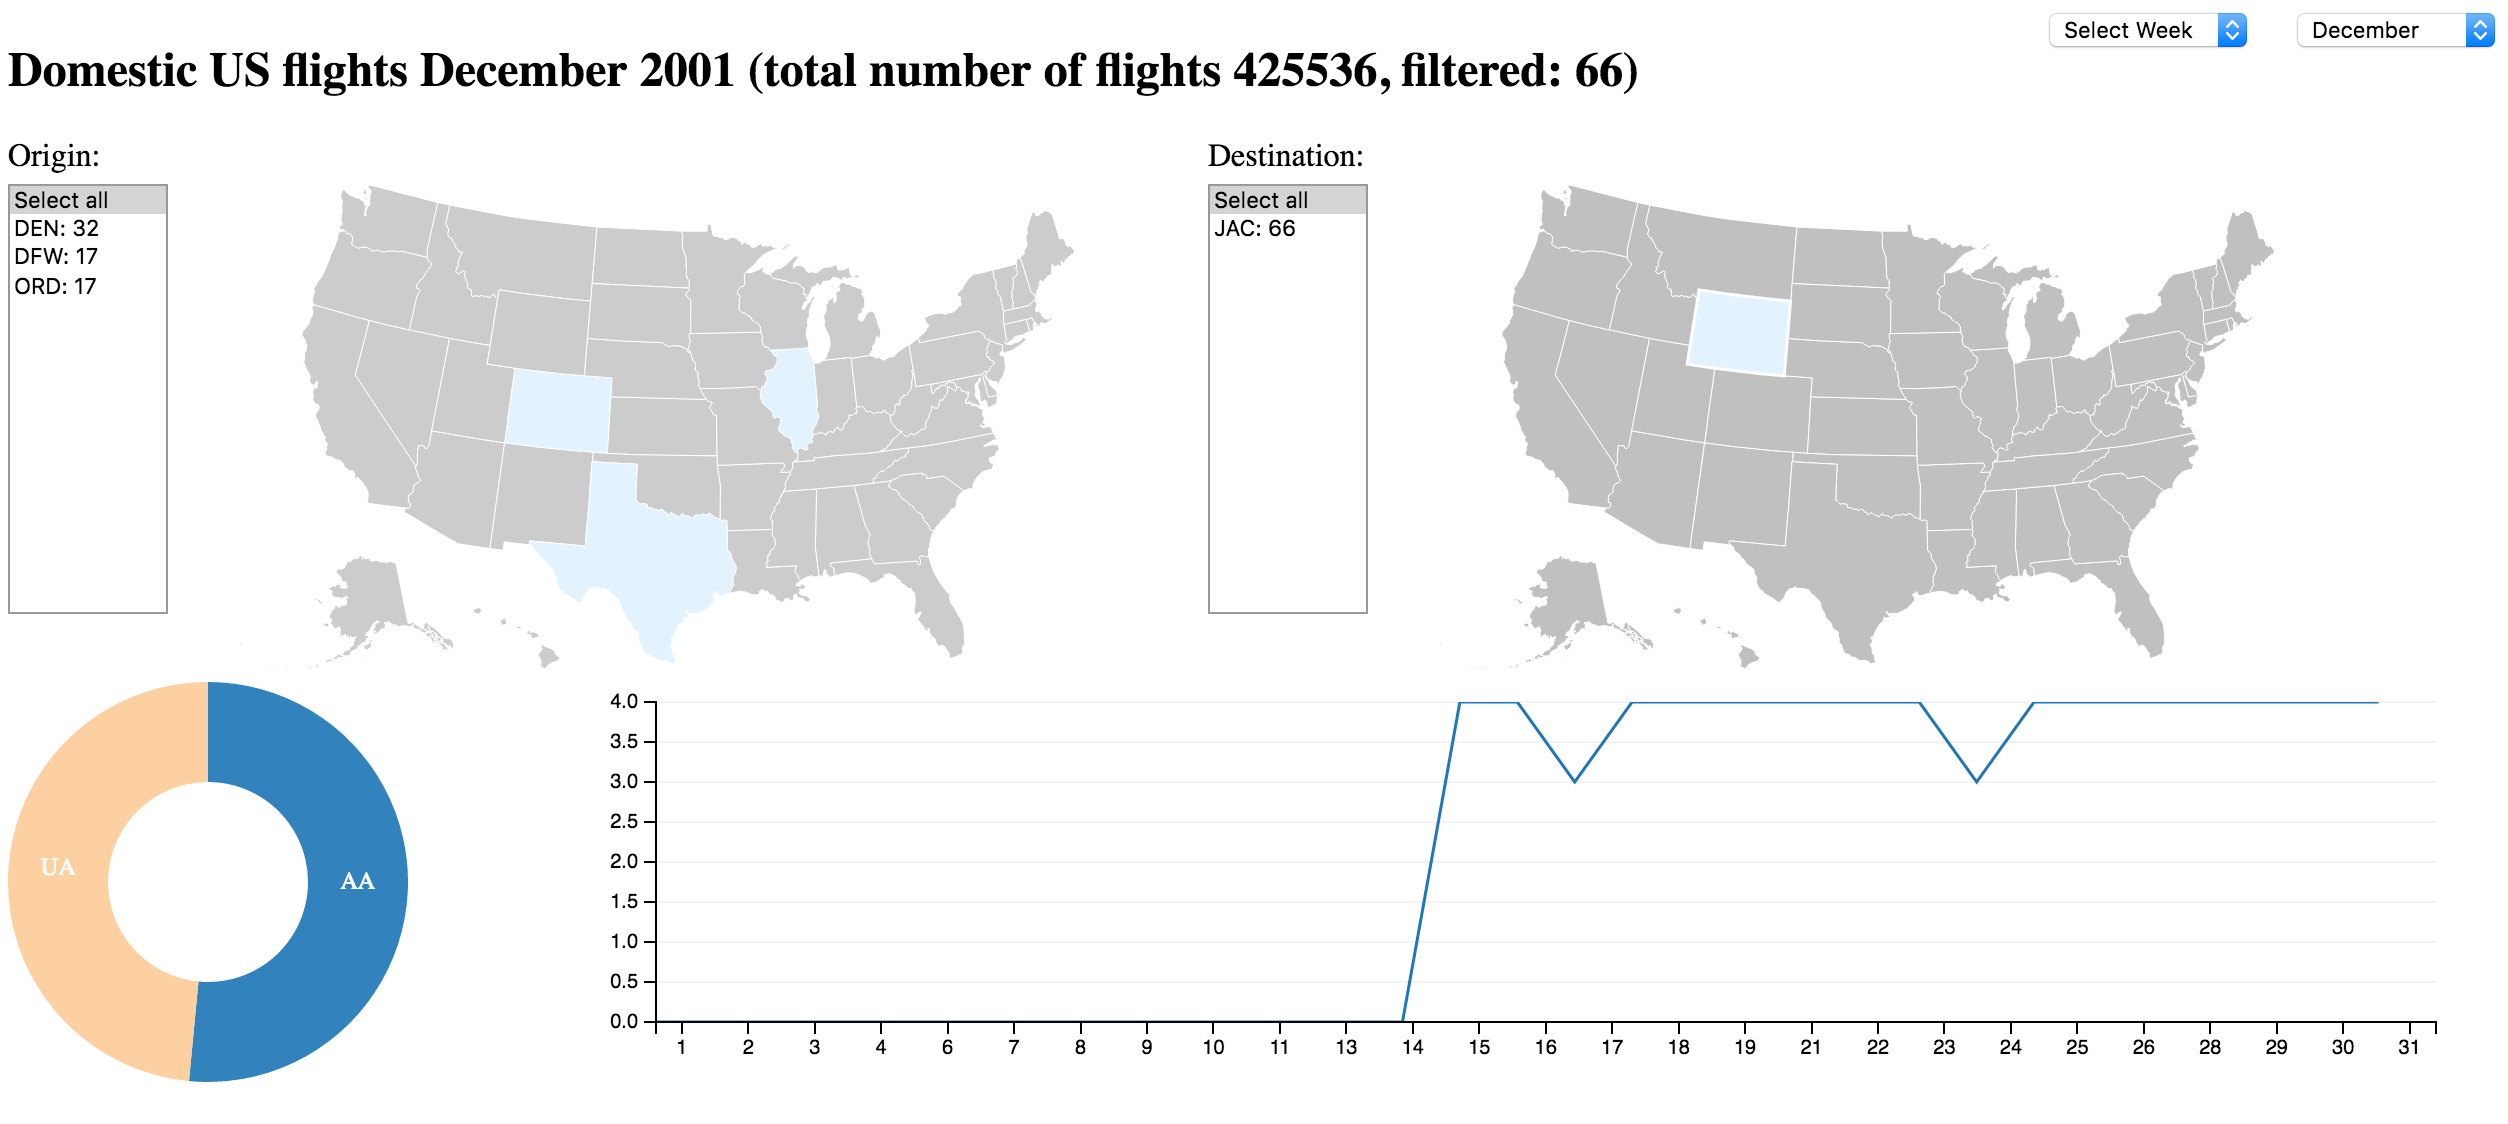
IV: D3 loading Segments from ELK
- Elasticsearch delivers data over HTTP/JSON using query
- D3/Crossfiler/DC display partion of data
- Partition could be month
- Manually selected by user
DC/D3/Crossfilter Dashboard loading segments from Elasticsearch
Network, Timing, Data Sizes
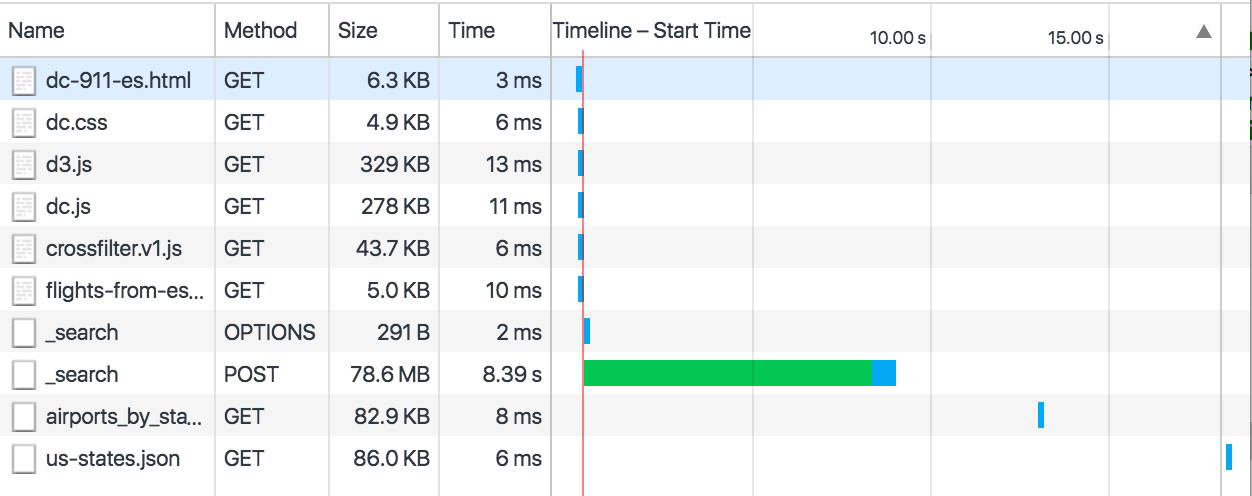
same amount of data sets, but almost 8x the size
can be optimized by just tranferring fields you really need
V: Jupyter/iPython Notebook
- Interactive REPL running in the browser
- Python server runs in the background
- Results (including graphics) are cached in the notebook
- can include documentation
optional
Our Notebook
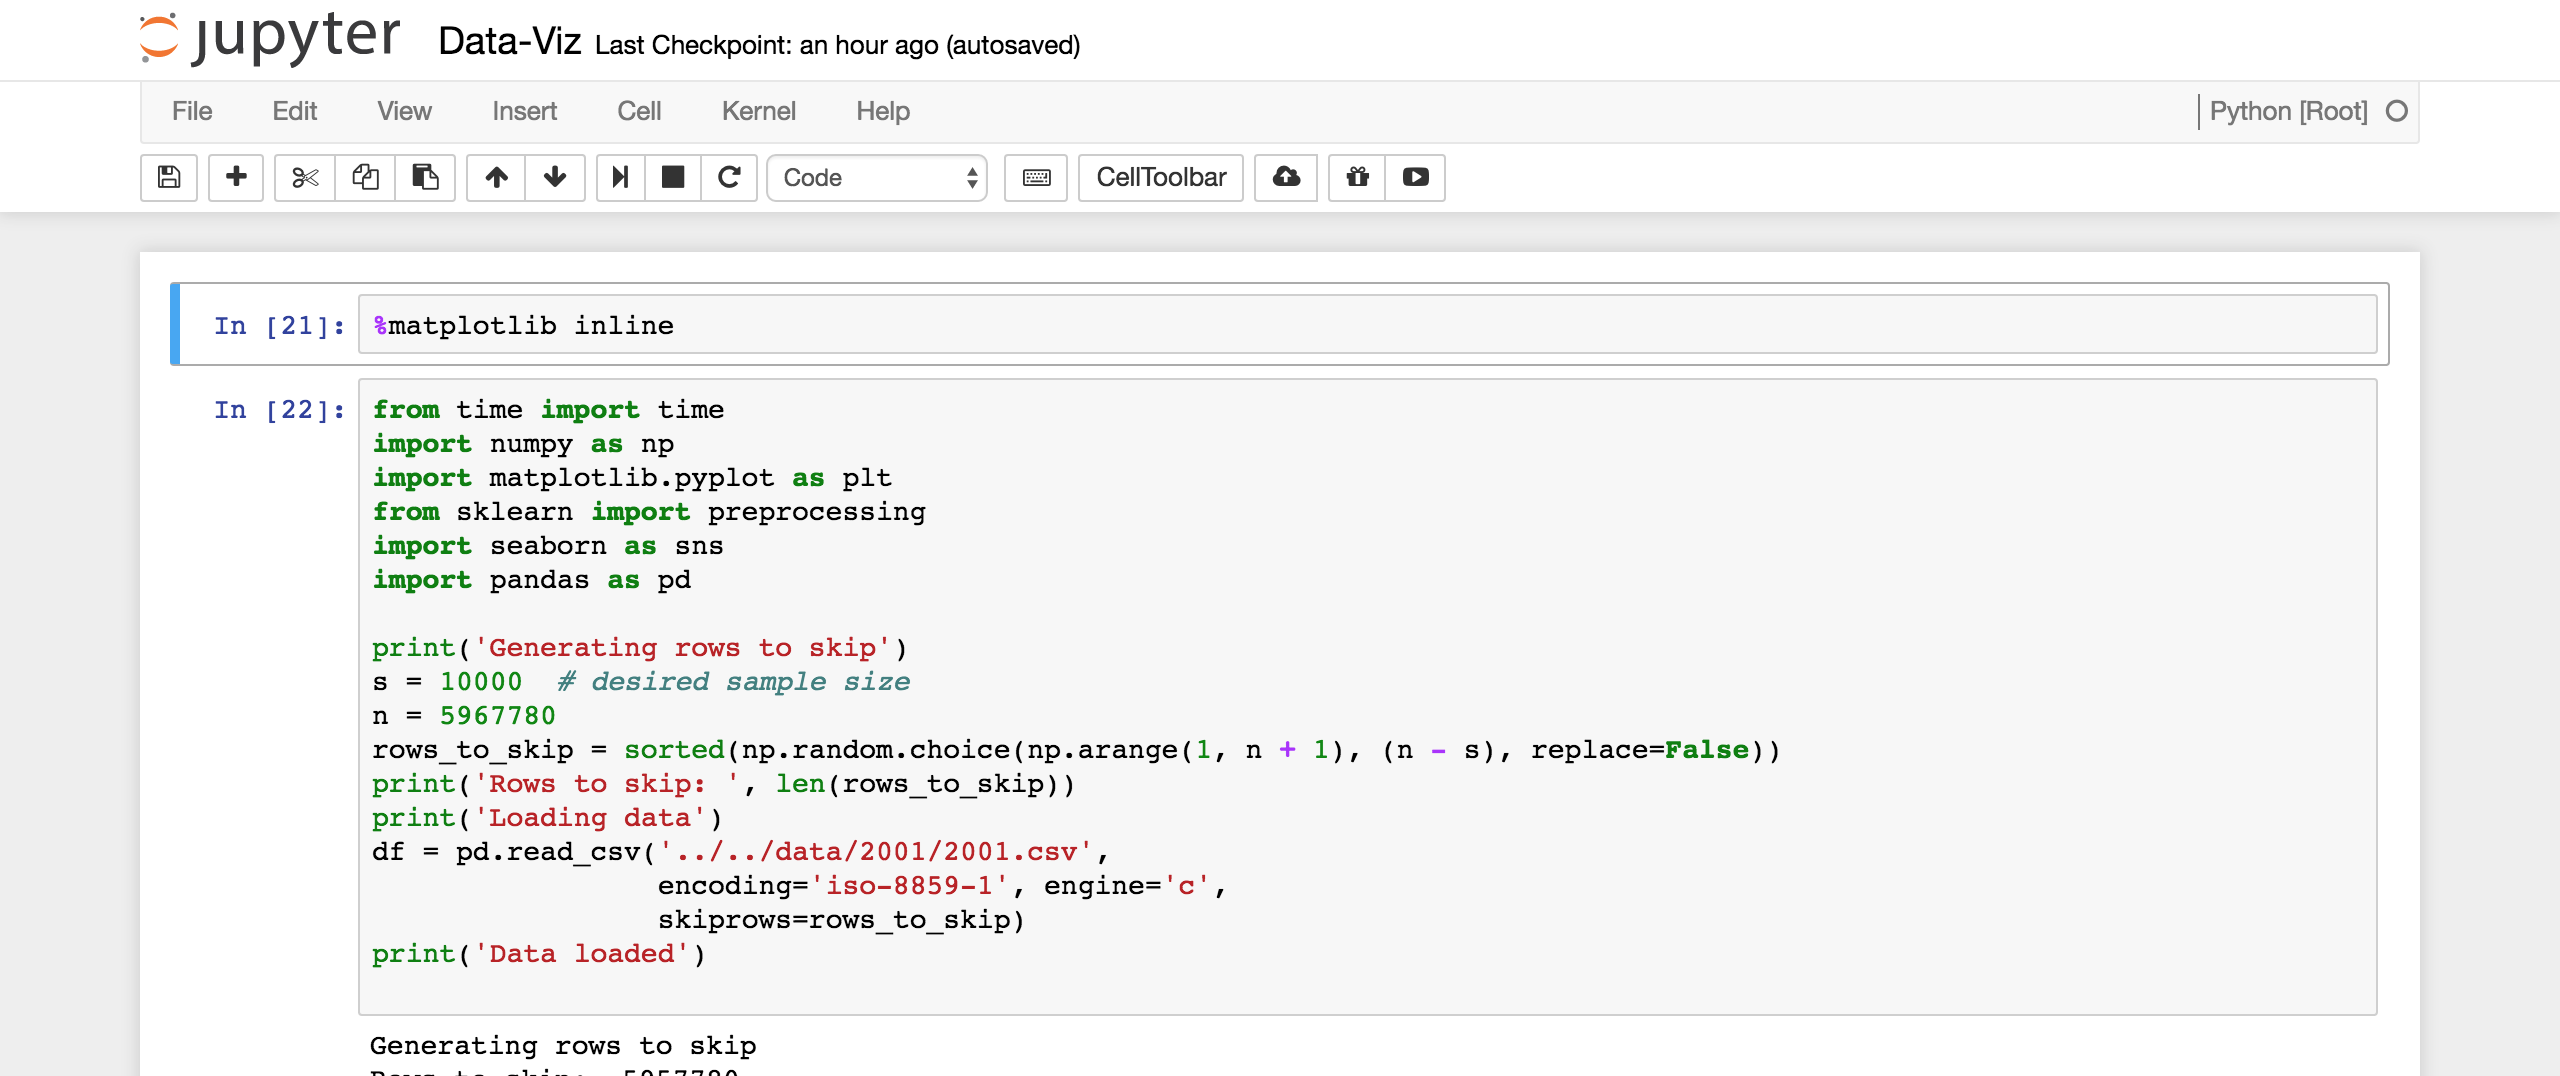
Working on a small sample (just 10000 data sets)
Introducing Pandas and friends
All live in the Python world
- http://pandas.pydata.org/: data structures and data analysis tools
- http://www.numpy.org/: fundamental package for scientific computing
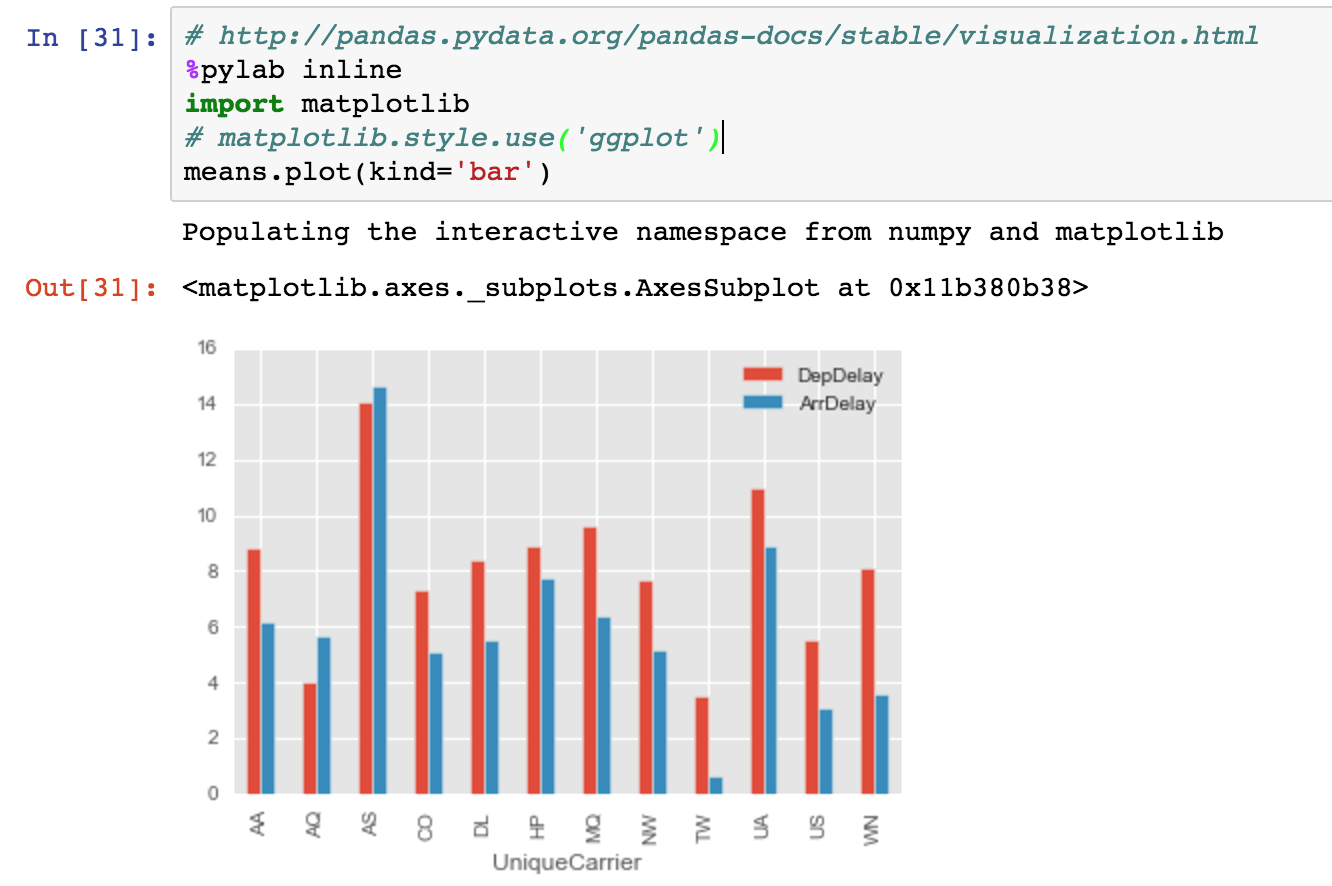
- http://matplotlib.org/: 2D plotting library
- https://stanford.edu/~mwaskom/software/seaborn/: statistical data visualization
Displaying graphics inline
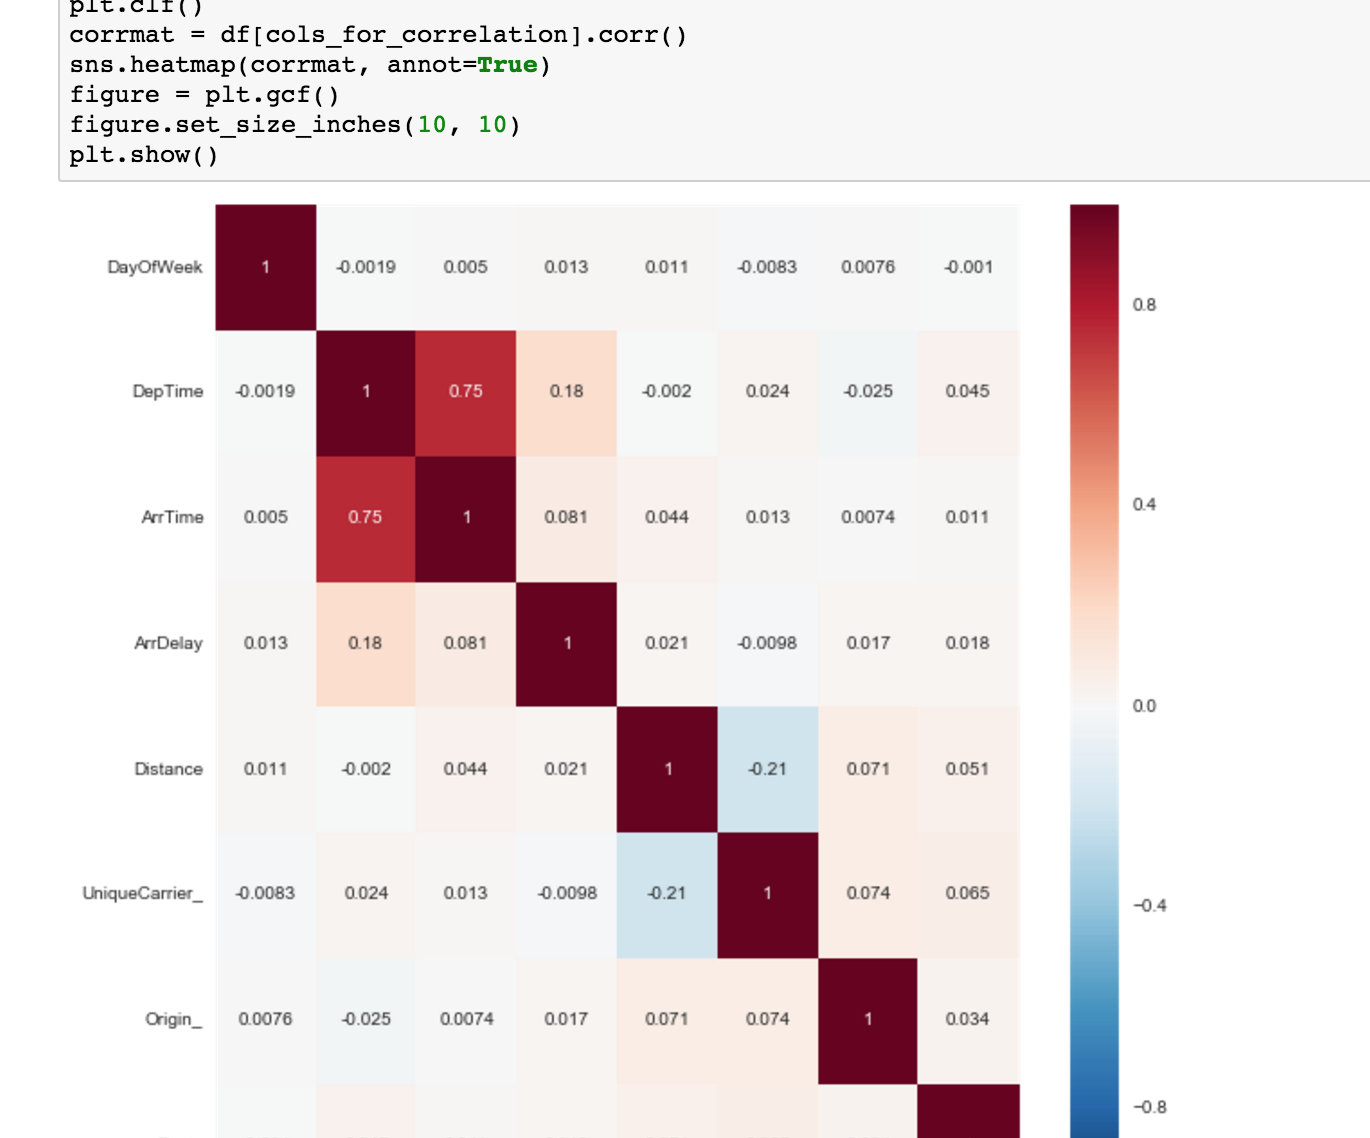
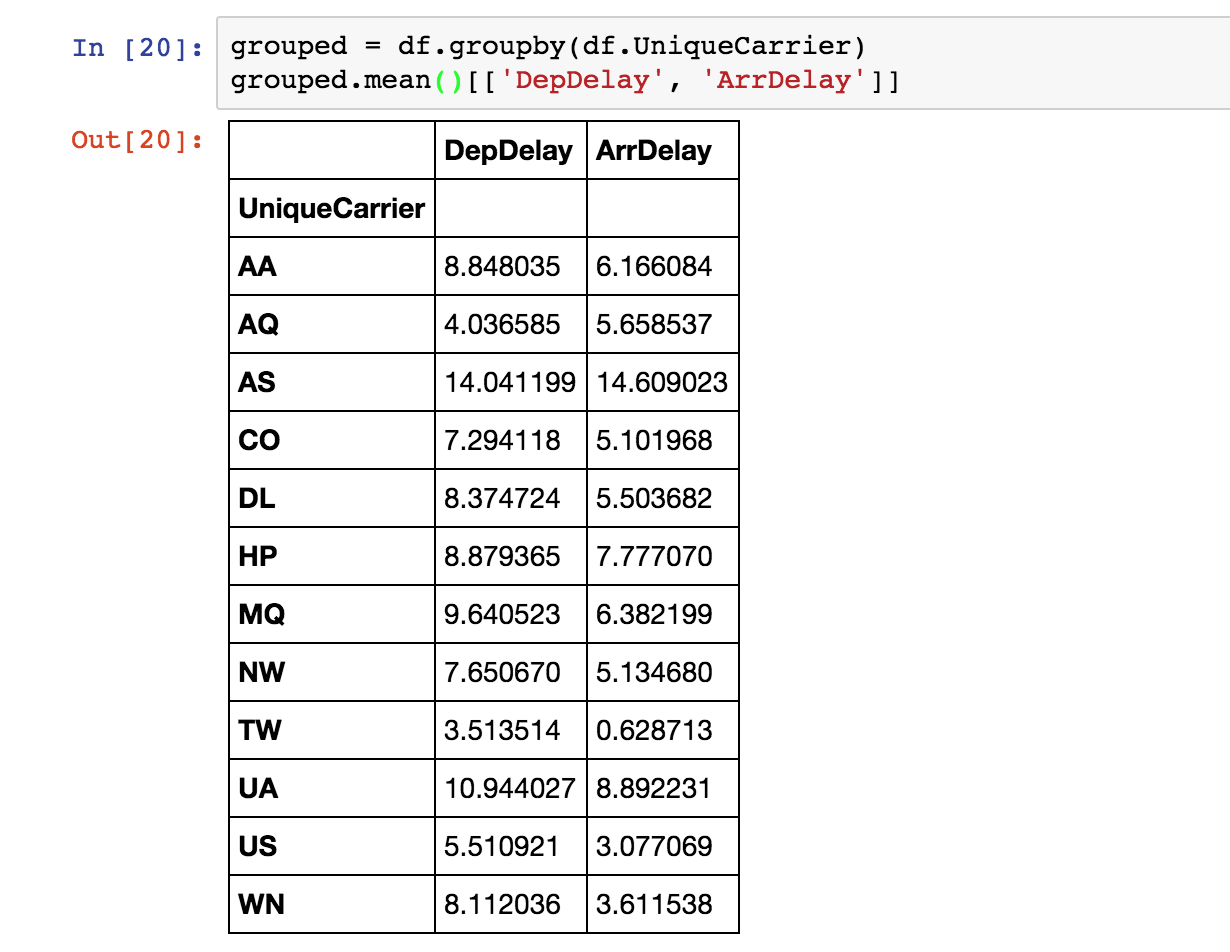
Aggregations
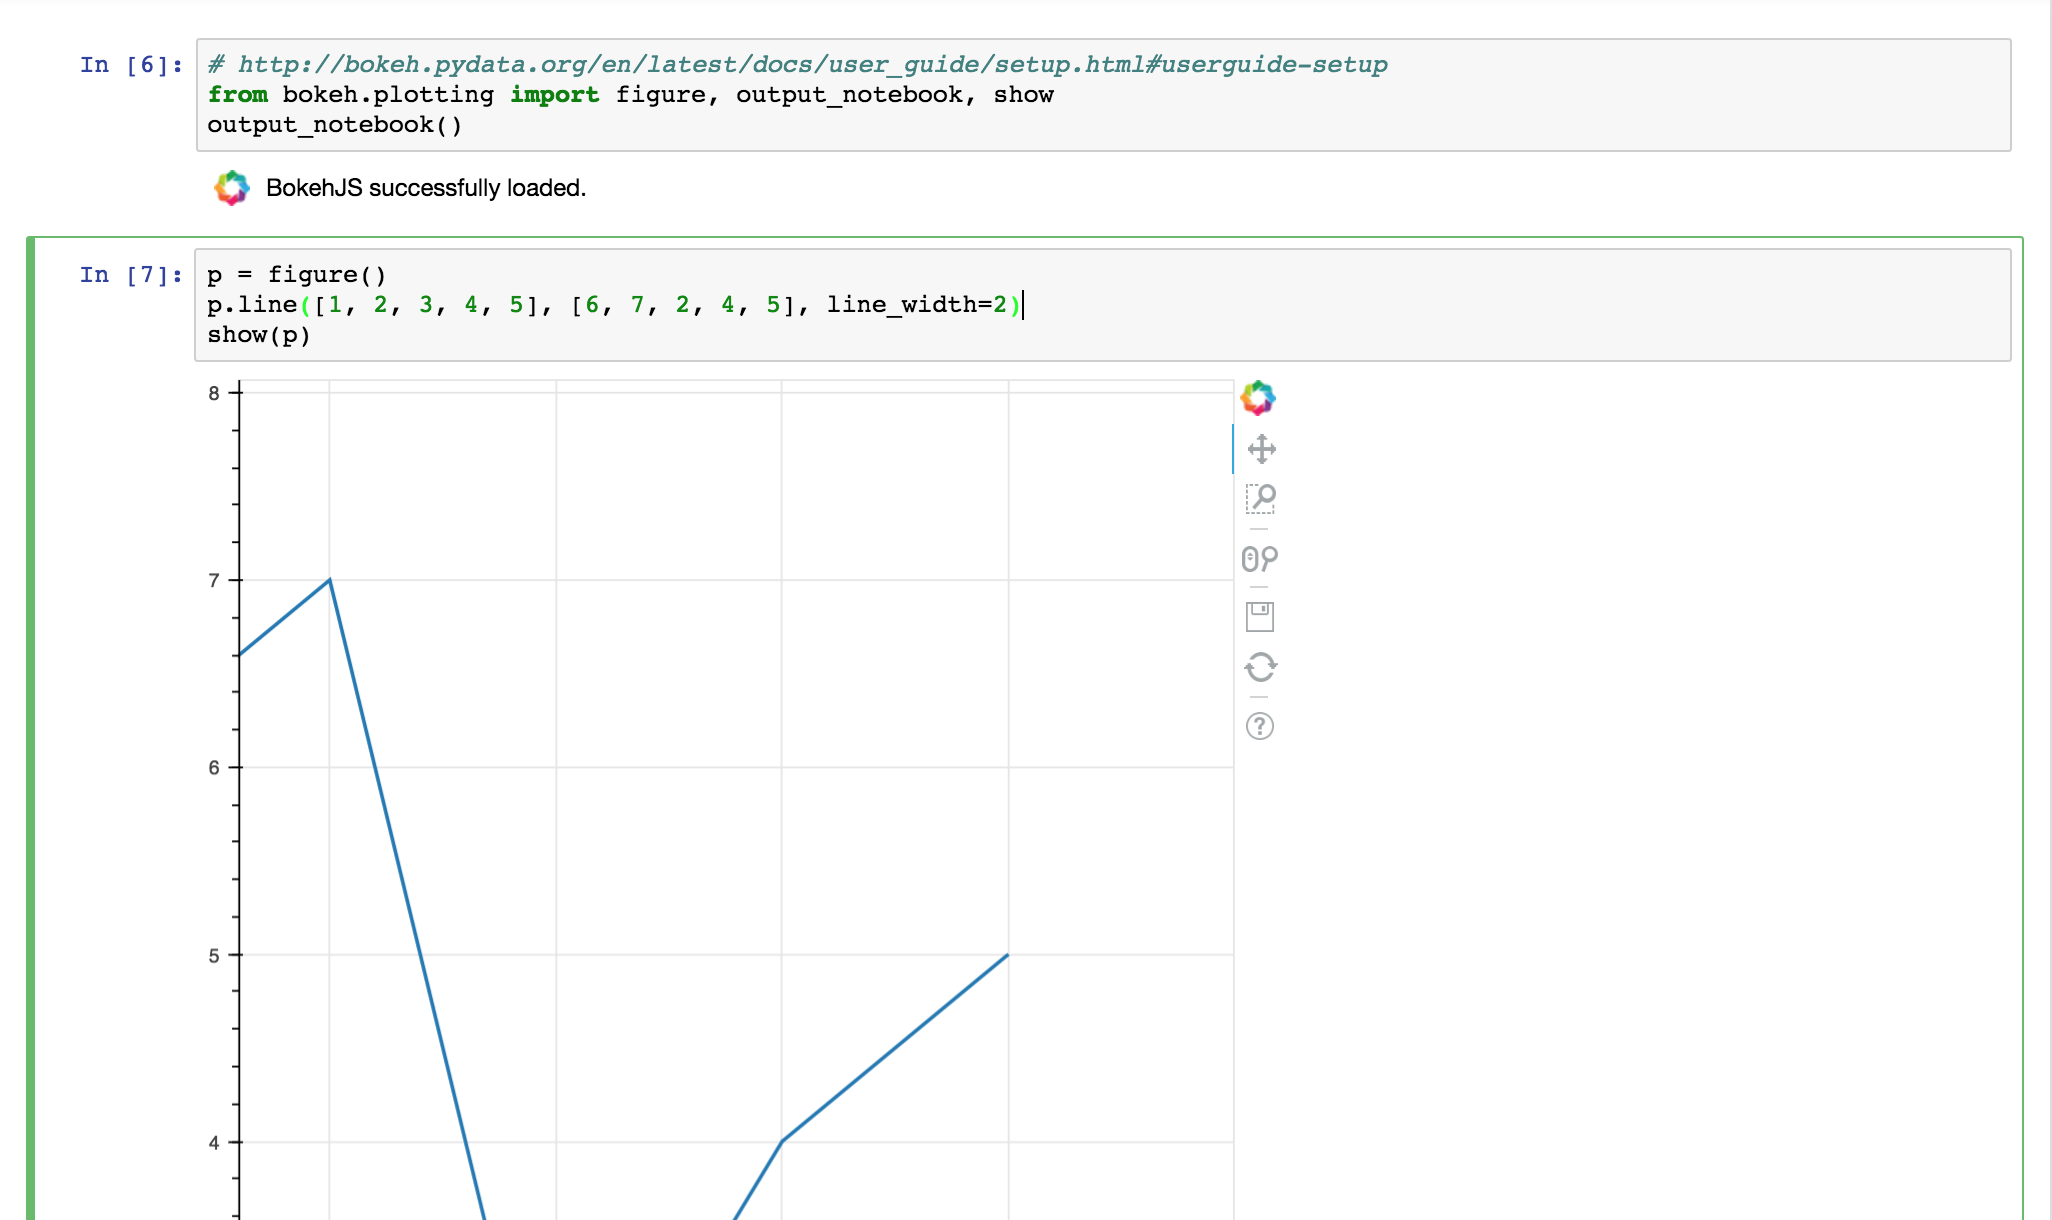
Bokeh for interactive graphics
Final Matrix
| Google Sheets | D3 | ELK | Segmented D3 | iPython | |
|---|---|---|---|---|---|
| One tool for designer / user | |||||
| Required effort | |||||
| Easy to create new dashboard | |||||
| Interactivity | |||||
| Unlimited data size | |||||
| Offline | |||||
| Unrestricted widgets | |||||
| Auto Refresh | |||||
| Repl | |||||
| Turn Query into Dashboard | |||||
| Add your category here | |||||
Thank you
Questions / Discussion
Code for all examples: https://github.com/DJCordhose/big-data-visualization/code
Slides: http://bit.ly/data2day-explore
Oliver Zeigermann / @DJCordhose