Interactive Data Exploration in the Browser
Using Interactive Data Visualization to
explore the world
not to tell a story
Credit for coining the term goes to @moritz_stefaner: Worlds, not Stories: data visualization as a macroscope
Example: Exploring all data sets of domestic US air-traffic
for September 2001
(400,000)
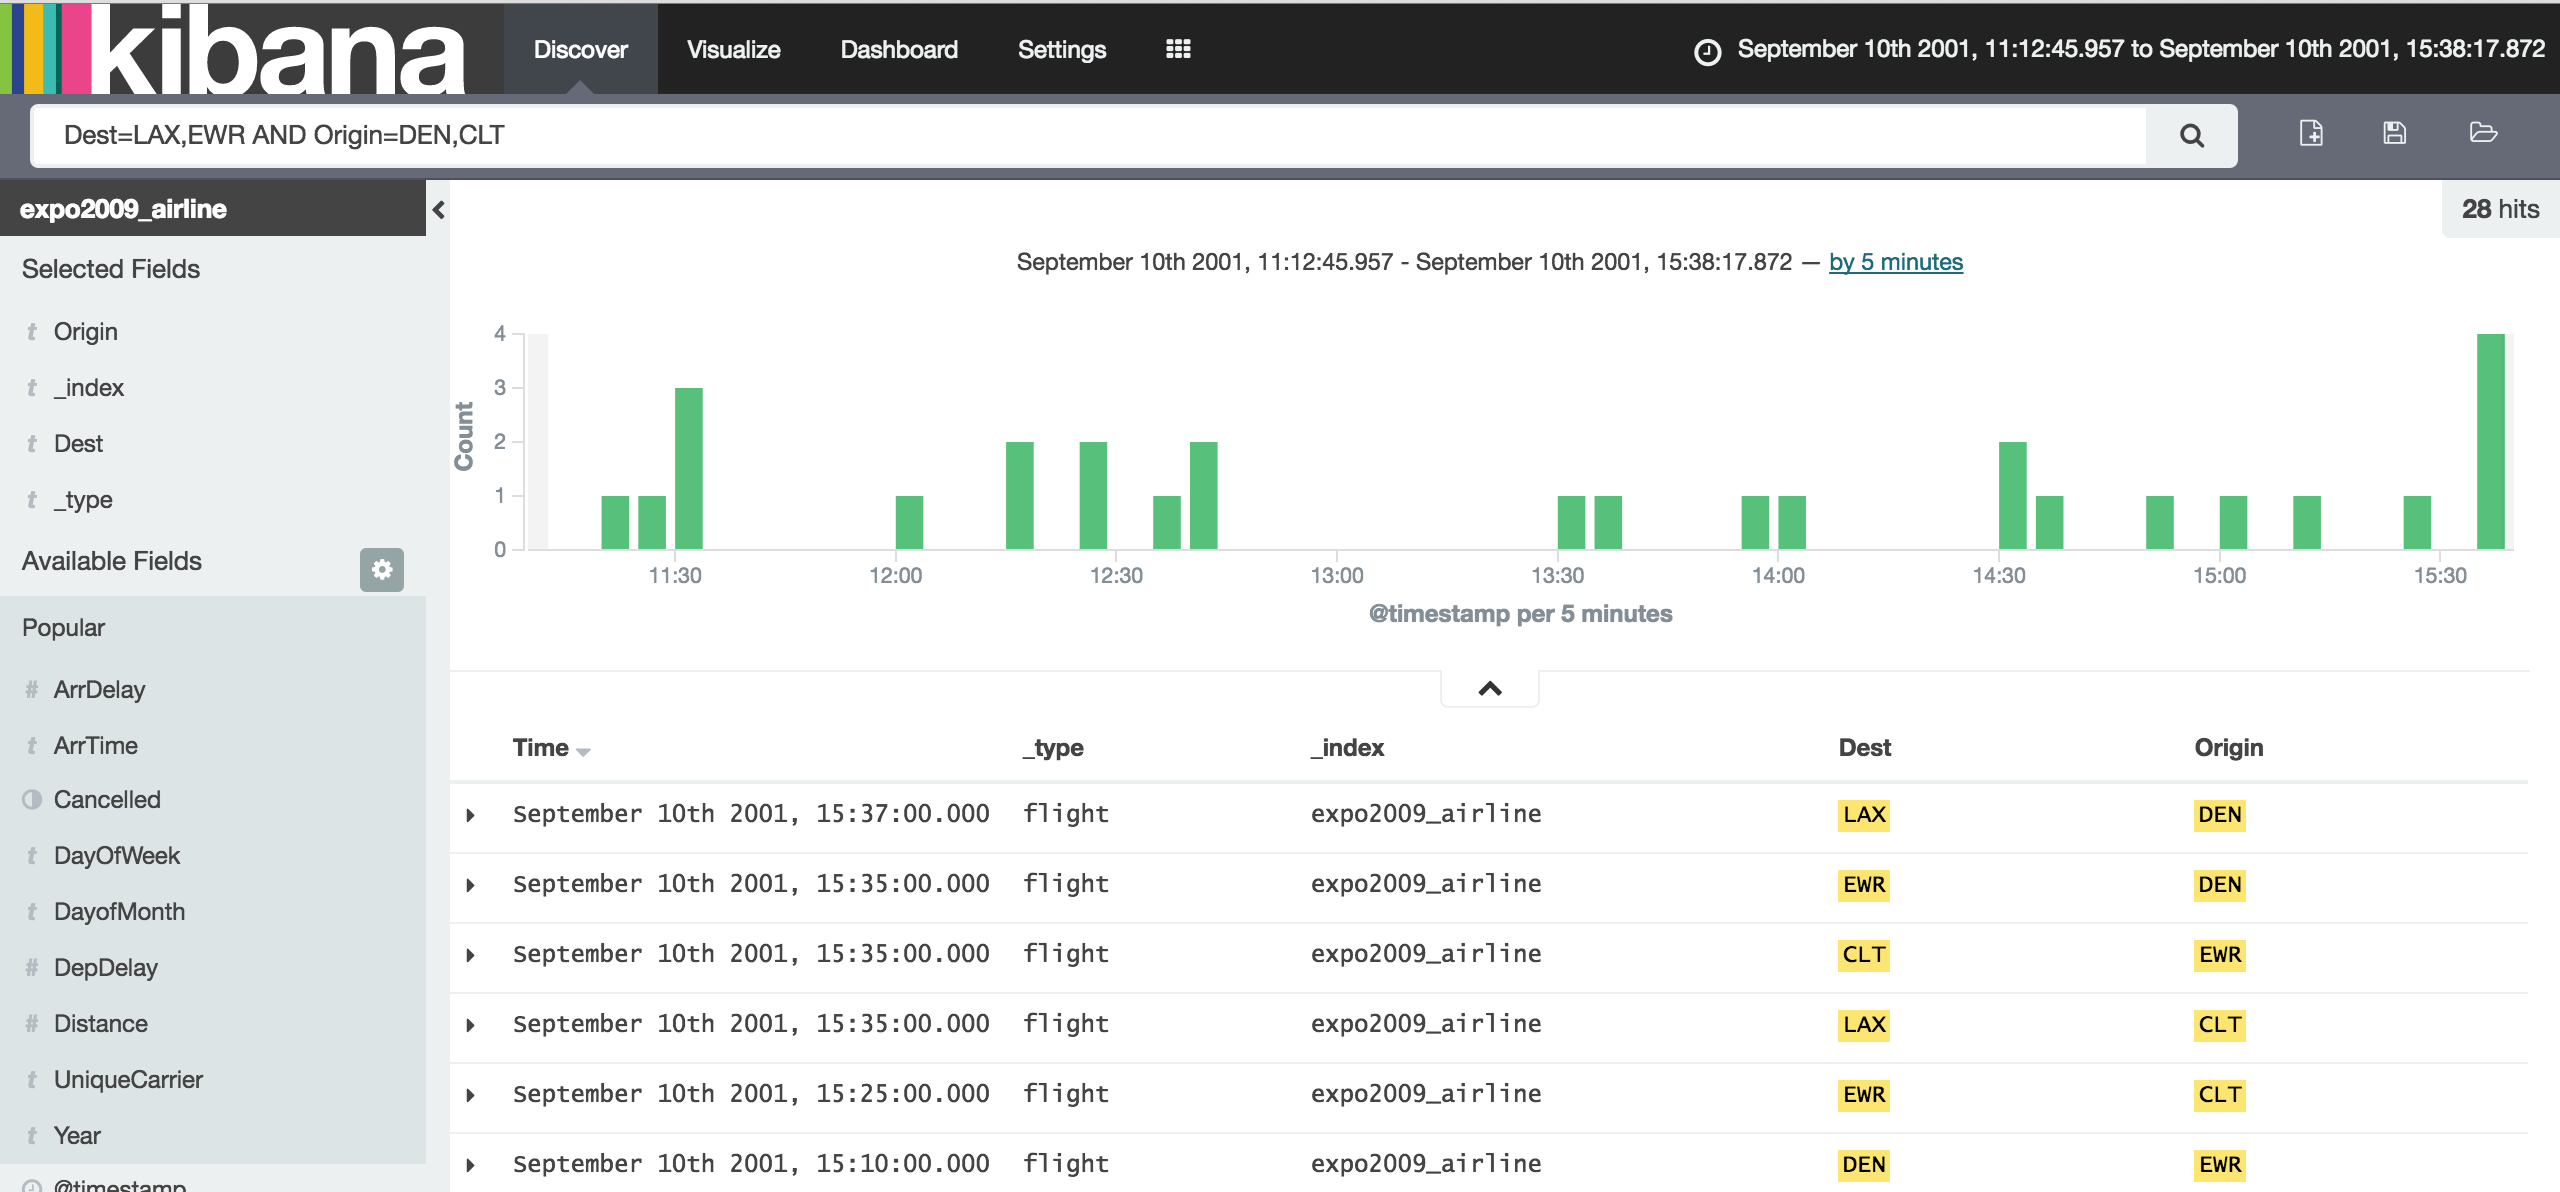
Option #1: Interactive queries using Elasticsearch/Kibana
Flights from LA or Newyark to Denver or Clinton between September 10th 2001, 11:12 and 15:38?
Option #2: Kibana interactive Dashboard
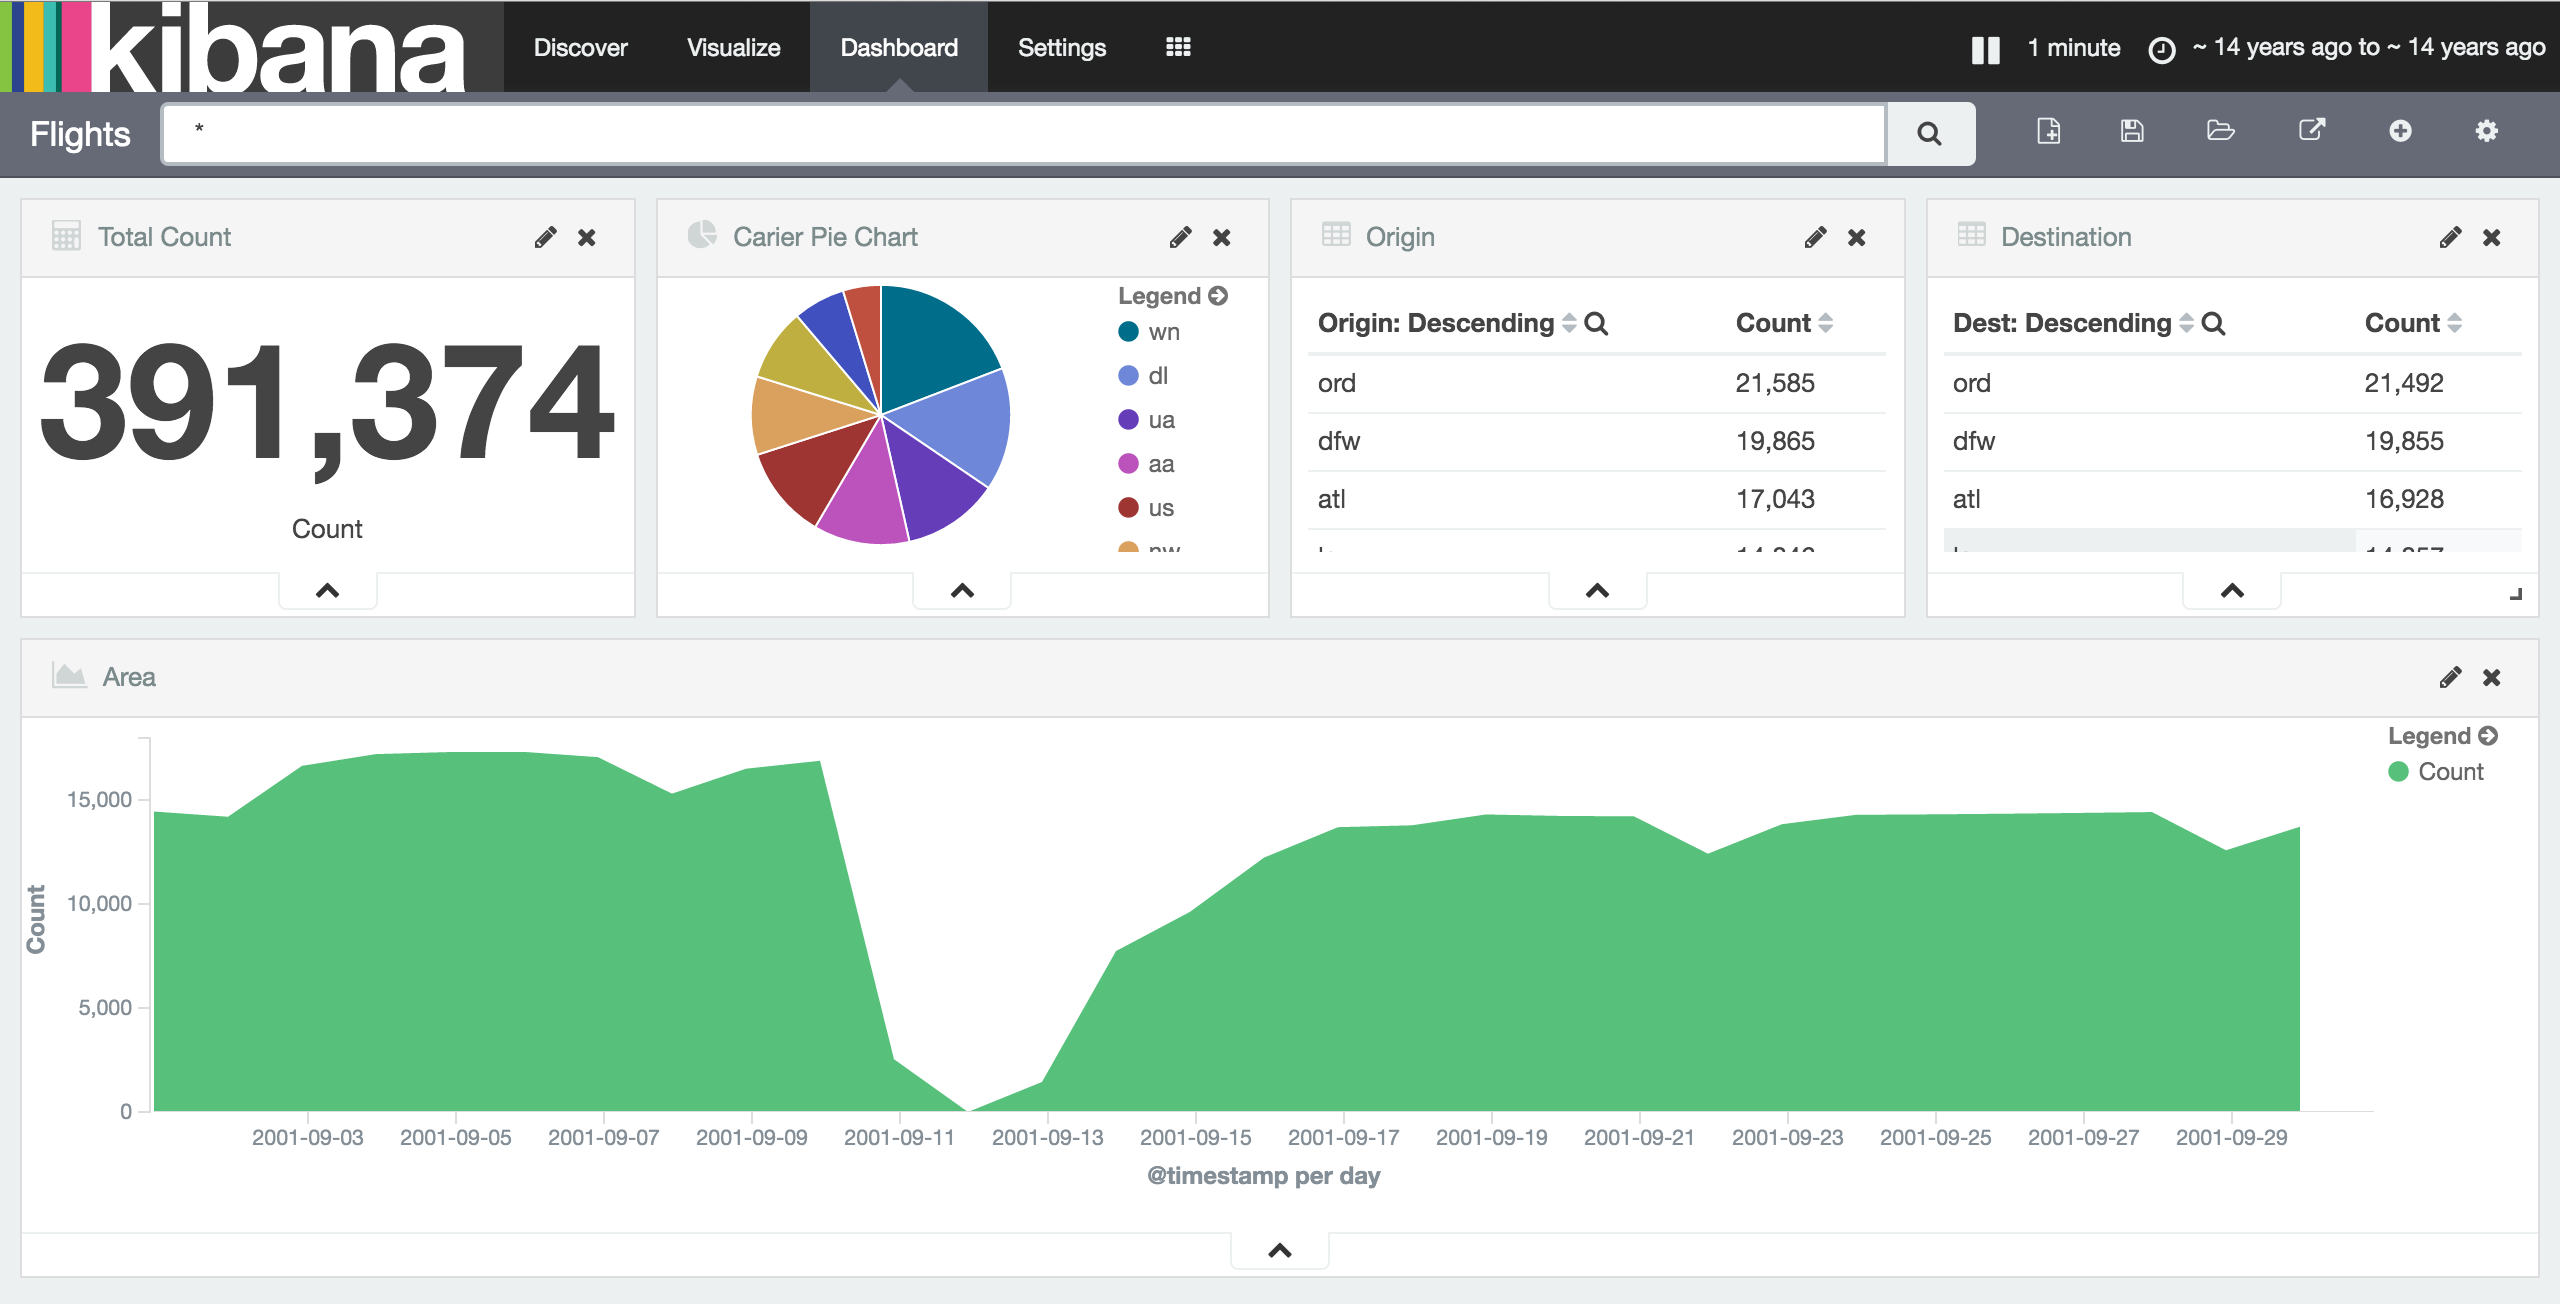
Clicks re-run augmented Elasticsearch query
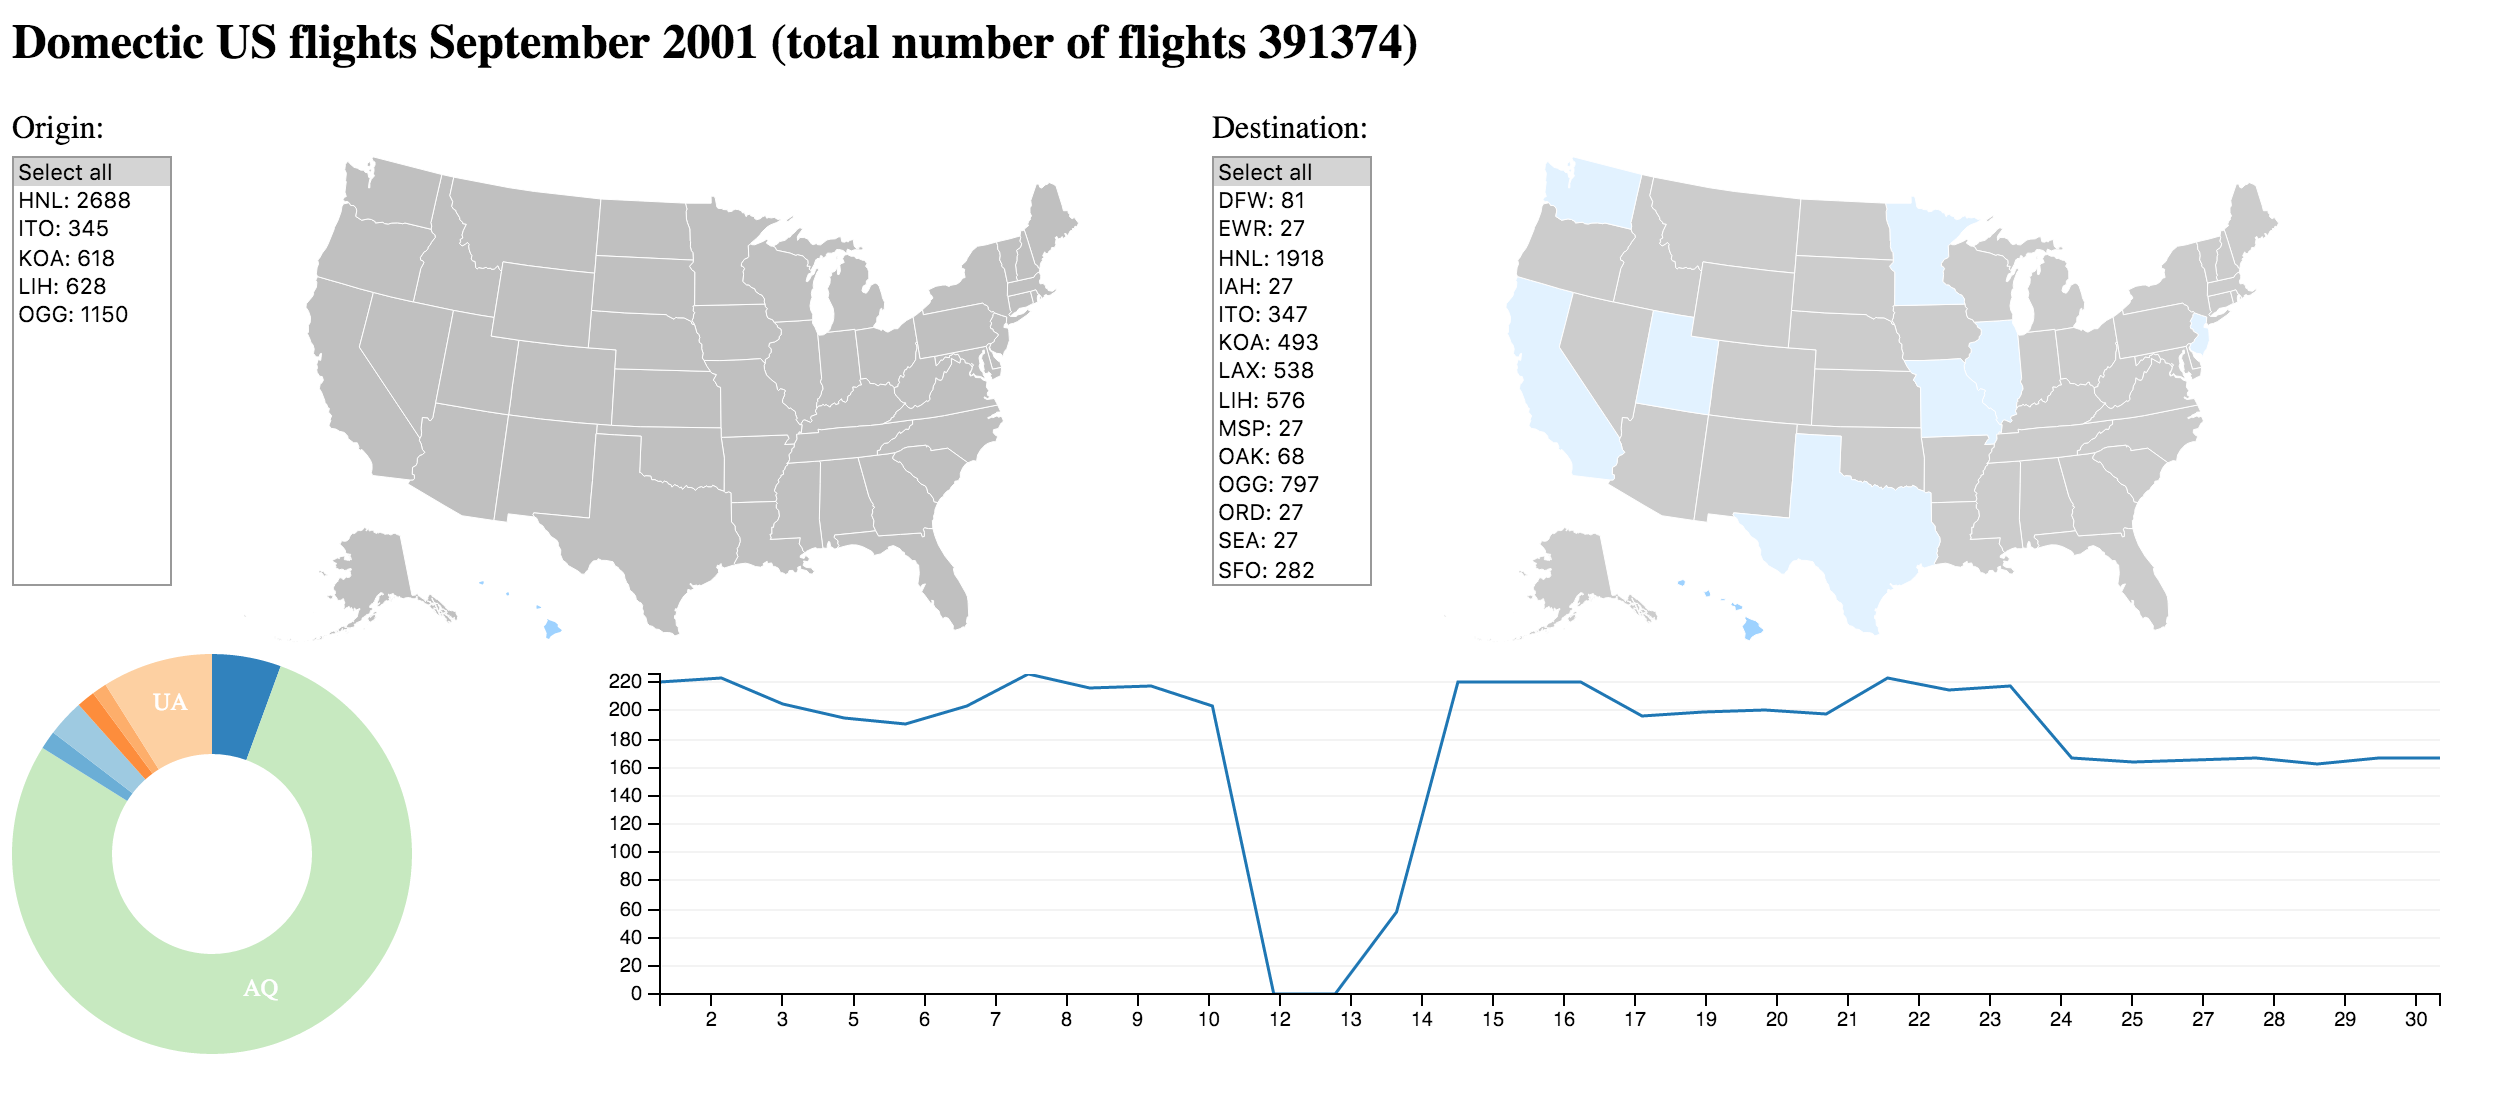
Option #3: Filtering directly in the browser using D3 with crossfilter and DC
Example: All flights from Hawaii
Thank you
Code: https://github.com/DJCordhose/big-data-visualization / https://github.com/DJCordhose/introduction-to-elasticsearch
Slides: https://djcordhose.github.io/big-data-visualization/2016_pydata_berlin_lightning.html
Oliver Zeigermann / @DJCordhose